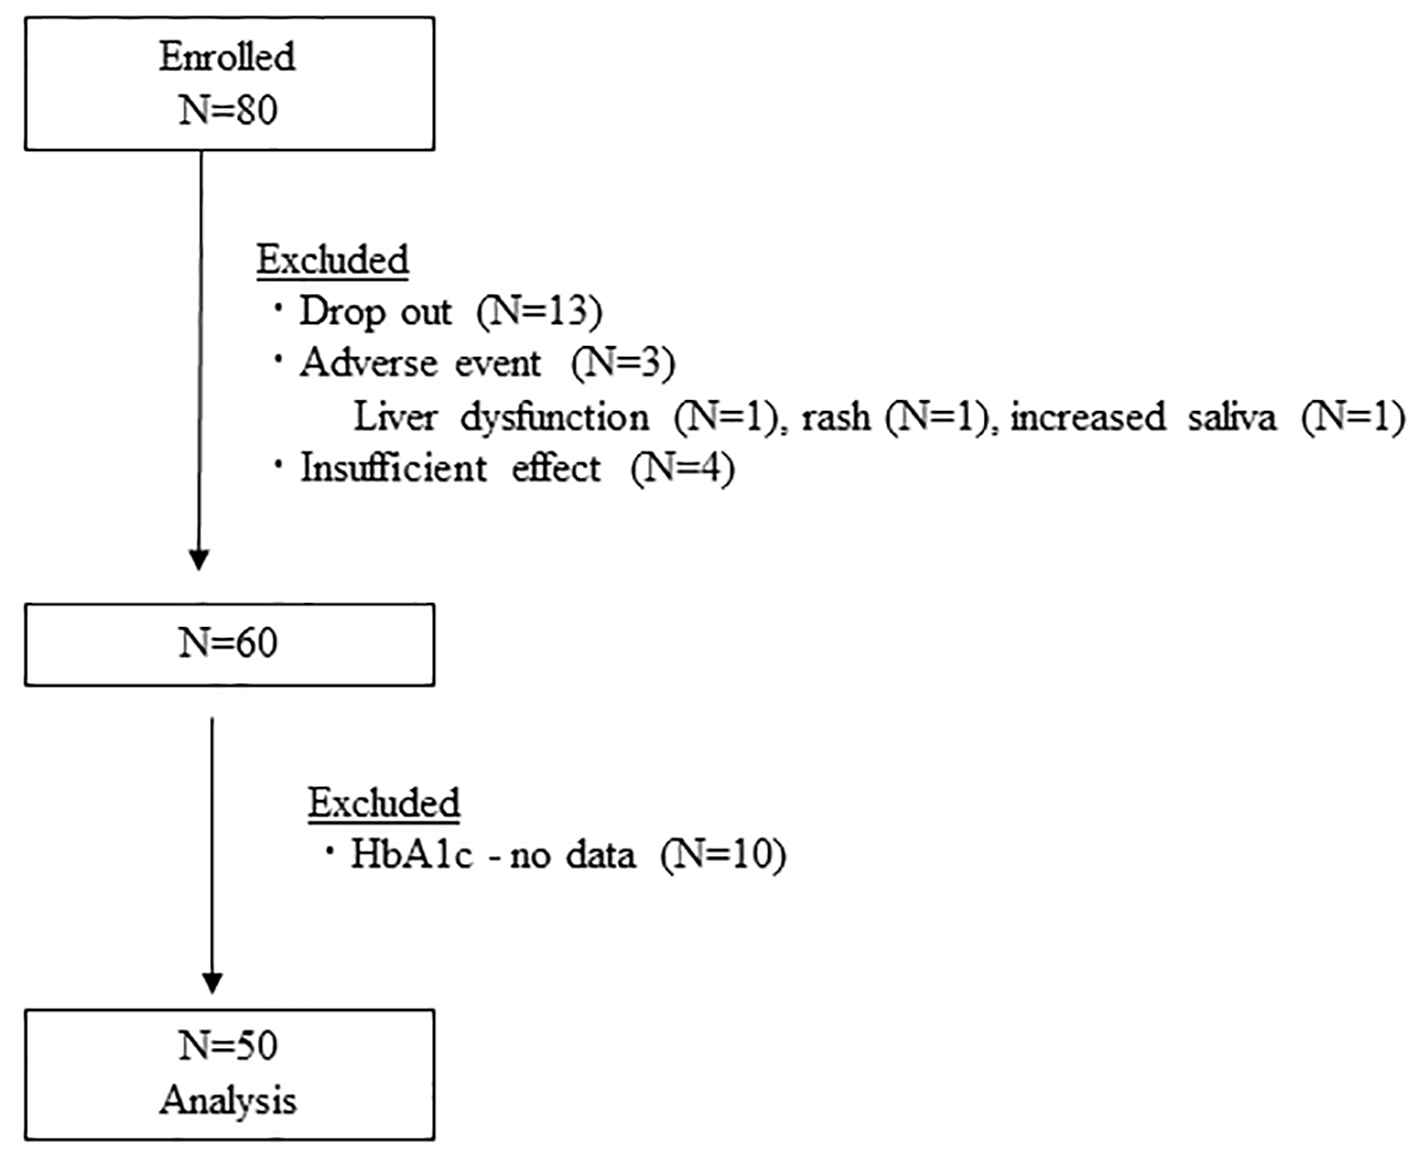
Figure 1. Flow diagram of study participants. HbA1c: hemoglobin A1c.
| Journal of Clinical Medicine Research, ISSN 1918-3003 print, 1918-3011 online, Open Access |
| Article copyright, the authors; Journal compilation copyright, J Clin Med Res and Elmer Press Inc |
| Journal website http://www.jocmr.org |
Original Article
Volume 12, Number 7, July 2020, pages 423-430
Comprehensive Efficacy of the Dipeptidyl Peptidase 4 Inhibitor Alogliptin in Practical Clinical Settings: A Prospective Multi-Center Interventional Observational Study
Figure
Tables
| Characteristics | N (%) |
|---|---|
| Data are the number (%) or means ± SD. SD: standard deviation; ACE: angiotensin-converting enzyme. | |
| N | 50 |
| Mean age (SD), years | 64.2 ± 11.7 |
| Male | 28 (56) |
| Duration, years | 4.3 ± 3.8 |
| Body mass index, kg/m2 | 26.0 ± 4.7 |
| Clinical presentation | |
| Hypertension | 37 (74) |
| Dyslipidemia | 35 (70) |
| Hyperuricemia | 6 (12) |
| Current smoking | 11 (22) |
| Current drinking | 29 (48) |
| Ischemic heart disease | 1 (2) |
| Previous stroke | 5 (10) |
| Diabetic retinopathy | 2 (4) |
| Diabetic nephropathy | 7 (14) |
| Diabetic neuropathy | 1 (2) |
| Medication | |
| Anti-hypertensive drugs | |
| Diuretic drugs | 8 (16) |
| Calcium channel blockers | 24 (48) |
| ACE inhibitors | 2 (4) |
| Angiotensin II receptor blockers | 19 (38) |
| Beta-blockers | 4 (8) |
| Anti-dyslipidemic drugs | |
| Statin | 18 (36) |
| Fibrates | 1 (2) |
| Ezetimibe | 3 (6) |
| Anti-thrombotic agents | 3 (6) |
| 0M | 6M | P (vs. 0M) | 12M | P (vs. 0M) | P value (repeated measures ANOVA) | |
|---|---|---|---|---|---|---|
| Data are the means ± standard deviation or the medians (interquartile range (IQR)). P values were obtained by the paired t-test. ANOVA: analysis of variance; SBP: systolic blood pressure; DBP: diastolic blood pressure; HR: heart rate; HbA1c: hemoglobin A1c; LDL-C: low-density lipoprotein cholesterol; HDL-C: high-density lipoprotein cholesterol; PLt: platelet; AST: aspartate transaminase; ALT: alanine transaminase; γ-GTP: gamma-glutamyl transpeptidase; UA: uric acid; eGFR: estimated glomerular filtration rate. | ||||||
| Body weight, kg (n = 46) | 67.0 ± 12.1 | 65.7 ± 12.9 | < 0.01 | 65.7 ± 12.9 | 0.03 | 0.02 |
| SBP, mm Hg (n = 48) | 136.9 ± 22.9 | 129.7 ± 18.4 | 0.045 | 130.0 ± 15.8 | 0.03 | 0.03 |
| DBP, mm Hg (n = 48) | 81.2 ± 13.8 | 74.8 ± 11.7 | < 0.01 | 75.6 ± 11.7 | < 0.01 | < 0.01 |
| HR, bpm (n = 39) | 74.2 ± 11.6 | 73.5 ± 11.8 | 0.68 | 76.3 ± 17.2 | 0.49 | 0.39 |
| HbA1c, % (n = 50) | 7.5 ± 1.4 | 6.4 ± 0.9 | < 0.01 | 6.2 ± 0.7 | < 0.01 | < 0.01 |
| Glucose, mg/dL (n = 36) | 172.1 ± 70.4 | 138.9 ± 46.6 | < 0.01 | No data | ||
| LDL-C, mg/dL (n = 29) | 121.1 ± 26.9 | 109.0 ± 27.2 | < 0.01 | 114.0 ± 23.8 | 0.04 | 0.07 |
| HDL-C, mg/dL (n = 31) | 54.3 ± 13.8 | 54.0 ± 15.1 | 0.78 | 54.6 ± 16.6 | 0.42 | 0.5 |
| Triglyceride, mg/dL (IQR) (n = 36) | 151 (117 - 220) | 127 (101 - 191) | 0.08 | 123 (94 - 171) | 0.03 | 0.02 |
| Non HDL-C, mg/dL (IQR) (n = 24) | 152 (126 - 169) | 137 (105 - 152) | 0.08 | 145 (110 - 165) | 0.10 | 0.21 |
| PLt, 106/µL (n = 29) | 22.6 ± 4.8 | 21.7 ± 3.9 | 0.07 | 21.2 ± 3.2 | 0.03 | 0.07 |
| AST, U/L (IQR) (n = 43) | 24 (22 - 32) | 21 (20 - 28) | 0.054 | 24 (21 - 28) | 0.45 | 0.28 |
| ALT, U/L (IQR) (n = 43) | 24 (20 - 47) | 21 (16 - 30) | 0.054 | 26 (18 - 36) | 0.23 | 0.1 |
| γ-GTP, U/L (IQR) (n = 36) | 42 (30 - 59) | 32 (23 - 49) | < 0.01 | 41 (23 - 55) | 0.03 | 0.08 |
| UA, mg/dL (n = 30) | 5.0 ± 1.2 | 5.3 ± 1.0 | 0.18 | 5.4 ± 1.2 | 0.2 | 0.34 |
| eGFR (n = 31) | 77.5 ± 22.3 | 74.0 ± 21.8 | 0.08 | 75.8 ± 17.4 | 0.02 | 0.24 |
| HbA1c (6M) - HbA1c (0M) | HbA1c (12M) - HbA1c (0M) | |
|---|---|---|
| HbA1c: hemoglobin A1c; BMI: body mass index; eGFR: estimated glomerular filtration rate; 0M: 0 months (baseline); 6M: after 6 months of treatment; 12M: after 12 months of treatment. | ||
| Age < 65 years (n = 27) | -1.37 | -1.35 |
| Age ≥ 65 years (n = 23) | -0.91 | -1.10 |
| P value | 0.34 | 0.64 |
| Duration < 5 years (n = 27) | -1.20 | -1.20 |
| Duration ≥ 5 years (n = 19) | -1.19 | -1.41 |
| P | 0.99 | 0.61 |
| BMI < 25 (n = 24) | -1.36 | -1.43 |
| BMI ≥ 25 (n = 26) | -0.97 | -1.04 |
| P | 0.30 | 0.31 |
| eGFR ≥ 60 (n = 30) | -1.07 | -1.09 |
| eGFR < 60 (n = 7) | -0.79 | -0.92 |
| P | 0.53 | 0.71 |
| r | P | |
|---|---|---|
| BMI: body mass index; SBP: systolic blood pressure; DBP: diastolic blood pressure; HR: heart rate; HbA1c: hemoglobin A1c; LDL-C: low-density lipoprotein cholesterol; TG: triglyceride; HDL-C: high-density lipoprotein cholesterol; ALT: alanine transaminase; γ-GTP: gamma-glutamyl transpeptidase; UA: uric acid; eGFR: estimated glomerular filtration rate; 0M: 0 months (baseline); 6M: after 6 months of treatment; 12M: after 12 months of treatment. | ||
| ΔHbA1c (HbA1c (0M) - HbA1c (6M)) 1.16 ± 1.29 (-0.6 to 5.5) | ||
| Age | -0.254 | 0.075 |
| BMI | -0.192 | 0.191 |
| Duration | -0.021 | 0.892 |
| SBP (0M) | 0.300 | 0.034 |
| DBP (0M) | 0.181 | 0.209 |
| HR (0M) | 0.108 | 0.466 |
| HbA1c (0M) | 0.768 | < 0.001 |
| LDL-C (0M) | 0.444 | 0.007 |
| TG (0M) | 0.174 | 0.309 |
| HDL-C (0M) | -0.089 | 0.608 |
| Non-HDL-C (0M) | 0.581 | 0.003 |
| ALT (0M) | -0.010 | 0.955 |
| γ-GTP | -0.254 | 0.141 |
| UA (0M) | -0.036 | 0.834 |
| eGFR (0M) | 0.347 | 0.035 |
| ΔHbA1c (HbA1c (0M) - HbA1c (12M)) 1.23 ± 1.24 (-0.9 to 5.6) | ||
| Age | -0.091 | 0.563 |
| BMI | -0.225 | 0.151 |
| Duration | -0.076 | 0.646 |
| SBP (0M) | 0.447 | 0.030 |
| DBP (0M) | 0.244 | 0.115 |
| HR (0M) | 0.241 | 0.124 |
| HbA1c (0M) | 0.848 | < 0.001 |
| LDL-C (0M) | 0.177 | 0.359 |
| TG (0M) | 0.020 | 0.917 |
| HDL-C (0M) | -0.039 | 0.840 |
| Non-HDL-C (0M) | 0.413 | 0.079 |
| ALT (0M) | -0.201 | 0.296 |
| γ-GTP | -0.273 | 0.160 |
| UA (0M) | 0.071 | 0.714 |
| GFR (0M) | 0.153 | 0.421 |
| r | P | |
|---|---|---|
| HbA1c: hemoglobin A1c; SBP: systolic blood pressure; 0M: 0 months (baseline); 6M: after 6 months of treatment; 12M: after 12 months of treatment. | ||
| ΔHbA1c (HbA1c (0M) - HbA1c (6M)) 1.16 ± 1.29 (-0.6 to 5.5) | ||
| HbA1c (0M) | 0.743 | < 0.01 |
| SBP (0M) | 0.074 | 0.612 |
| ΔHbA1c (HbA1c (0M) - HbA1c (12M)) 1.23 ± 1.24 (-0.9 to 5.6) | ||
| HbA1c (0M) | 0.810 | < 0.01 |
| SBP (0M) | 0.142 | 0.369 |