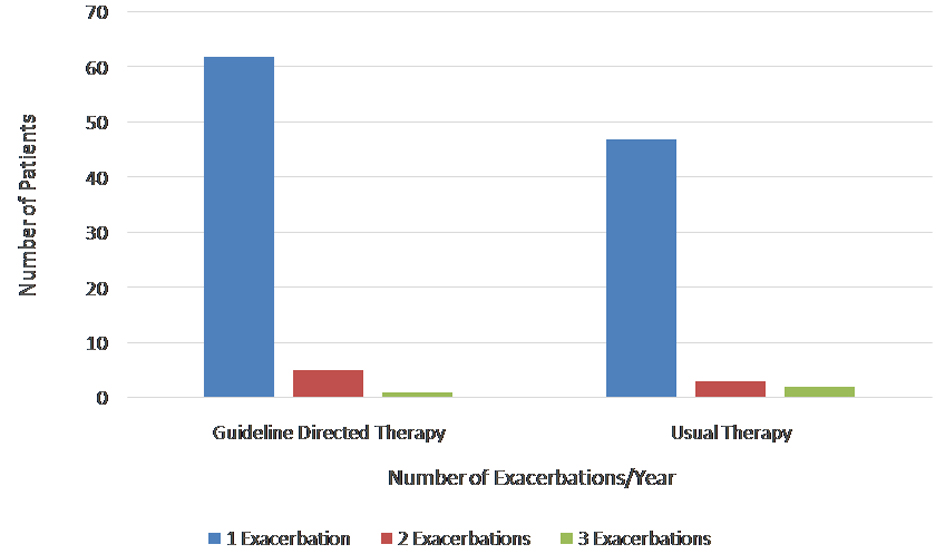
Figure 1. Frequencies of number of exacerbations per year.
| Journal of Clinical Medicine Research, ISSN 1918-3003 print, 1918-3011 online, Open Access |
| Article copyright, the authors; Journal compilation copyright, J Clin Med Res and Elmer Press Inc |
| Journal website http://www.jocmr.org |
Original Article
Volume 12, Number 6, June 2020, pages 362-368
Outpatient Management of Bronchial Asthma: A Comparative Analysis Between Guideline-Directed Management and Usual Management
Figure
Tables
| Variable | Guideline-directed medical therapy (n = 139) | Usual medical therapy (n = 161) | P |
|---|---|---|---|
| aIndependent t-test; bChi-square and Fisher’s exact test. NS: not significant; BMI: body mass index; SD: standard deviation. | |||
| Age (years), mean (SD) | 56.7 (15.6) | 56.7 (15.8) | 0.986a |
| Gender | |||
| Male (n, %) | 40 (28.8) | 45 (28) | 0.874b |
| Female (n, %) | 99 (71.2) | 116 (72) | 0.874b |
| Race | 0.796b | ||
| White (n, %) | 88 (63.3) | 107 (66.5) | |
| Black (n, %) | 24 (17.3) | 22 (13.7) | |
| Hispanic (n, %) | 21 (15.1) | 23 (14.3) | |
| Asian (n, %) | 6 (4.3) | 9 (5.6) | |
| Social factor, cigarette smoking (n, %) | 52 (37.4) | 71 (44.1) | 0.240b |
| BMI (kg/m2), mean (SD) | 32.1 (8.3) | 31.6 (7.2) | 0.635a |
| Asthma severity | 0.394b | ||
| Mild (n, %) | 131 (94.2) | 155 (96.3) | |
| Moderate (n, %) | 8 (5.8) | 5 (3.1) | |
| Severe (n, %) | 0 (0.0) | 1 (0.6) | |
| Variable | Guideline-directed medical therapy (n = 139) | Usual medical therapy (n = 161) | Pa |
|---|---|---|---|
| aChi-square and Fisher’s exact test. CHF: congestive heart failure; ESRD: end-stage renal disease; ESLD: end-stage liver disease; GERD: gastroesophageal reflux disorder; COPD: chronic obstructive pulmonary disease. | |||
| CHF (n, %) | 14 (10.1) | 16 (9.9) | 0.969 |
| ESRD (n, %) | 1 (0.7) | 0 (0.0) | 0.463 |
| ESLD (n, %) | 3 (2.2) | 2 (1.2) | 0.537 |
| Anemia (n, %) | 22 (15.8) | 27 (16.8) | 0.826 |
| Rheumatoid arthritis (n, %) | 5 (3.6) | 10 (6.2) | 0.300 |
| Multisystem rheumatic disorder (n, %) | 12 (8.6) | 9 (5.6) | 0.303 |
| Psychiatric diseases (n, %) | 50 (36.0) | 82 (50.9) | 0.650 |
| GERD (n, %) | 61 (43.9) | 75 (46.6) | 0.640 |
| COPD (n, %) | 11 (7.9) | 19 (11.8) | 0.263 |
| Allergic rhinitis (n, %) | 52 (5.8) | 63 (39.1) | 0.760 |
| Atopic dermatitis (n, %) | 8 (17.6) | 14 (8.7) | 0.330 |
| Nasal polyp (n, %) | 1 (0.7) | 1 (0.6) | 1.000 |
| Eosinophilia (n, %) | 10 (8.6) | 12 (9.0) | 0.926 |
| Variable | Odds ratioa | 95% confidence interval odds ratio | |
|---|---|---|---|
| Lower | Upper | ||
| aLogistic regression. BMI: body mass index; COPD: chronic obstructive pulmonary disease; CHF: congestive heart failure; ESLD: end-stage liver disease; GERD: gastroesophageal reflux disorder. | |||
| Age | 1.02 | 0.99 | 1.04 |
| Race | |||
| Caucasian vs. black | 1.06 | 0.46 | 2.44 |
| Caucasian vs. Hispanic | 0.93 | 0.38 | 2.25 |
| Caucasian vs. Asian | 1.99 | 0.50 | 7.94 |
| BMI | 1.03 | 0.99 | 1.07 |
| COPD overlap | 2.755 | 0.80 | 9.45 |
| CHF | 4.34 | 1.25 | 15.01 |
| ESLD | 0.17 | 0.01 | 3.78 |
| Rheumatoid arthritis | 0.86 | 0.21 | 3.56 |
| Multisystem disease | 1.24 | 0.35 | 4.43 |
| Psychiatric disease | 0.87 | 0.45 | 1.65 |
| GERD | 0.92 | 0.48 | 1.78 |
| Asthma severity | 9.72 | 4.83 | 19.60 |
| Smoking history | 1.48 | 0.79 | 2.79 |
| Allergic rhinitis | 2.04 | 1.03 | 4.03 |
| Atopic dermatitis | 1.10 | 0.24 | 4.99 |
| Nasal polyps | 1.71 | 0.09 | 33.20 |
| Eosinophilia | 0.60 | 0.18 | 2.00 |
| Medication | Guideline-directed medical therapy (n = 139) | Usual medical therapy (n = 161) | Pa |
|---|---|---|---|
| aChi-square and Fisher’s exact test. | |||
| Short-acting beta agonist (n, %) | 138 (99.3) | 83 (51.6) | < 0.001 |
| Inhaled corticosteroid (n, %) | 69 (49.6) | 54 (33.5) | 0.005 |
| Low (n, %) | 15 (10.8) | 19 (11.8) | |
| Medium (n, %) | 27 (19.4) | 22 (13.7) | |
| High (n, %) | 27 (19.4) | 13 (8.1) | |
| Long-acting beta agonist (n, %) | 48 (34.5) | 34 (21.1) | 0.009 |
| Long-acting muscarinic antagonist (n, %) | 3 (2.2) | 16 (9.9) | 0.006 |
| Leukotriene inhibitor (n, %) | 23 (16.5) | 61 (37.9) | < 0.001 |
| Omalizumab (n, %) | 2 (1.4) | 0 (0.0) | 0.214 |
| Patient outcome | Guideline-directed medical therapy (n = 139) | Usual medical therapy (n = 161) | Pa |
|---|---|---|---|
| aa aIndependent t-test. | |||
| Number of exacerbations | 0.034 | ||
| 0 (n, %) | 72 (51.8) | 109 (67.7) | |
| 1 (n, %) | 61 (43.9) | 47 (29.2) | |
| 2 (n, %) | 5 (3.6) | 3 (1.9) | |
| 3 (n, %) | 1 (0.7) | 2 (1.2) | |
| Number of hospitalizations | 0.349 | ||
| 0 (n, %) | 131 (94.2) | 155 (96.3) | |
| 1 (n, %) | 8 (5.8) | 5 (3.1) | |
| 2 (n, %) | 0 (0.0) | 1 (0.6) | |