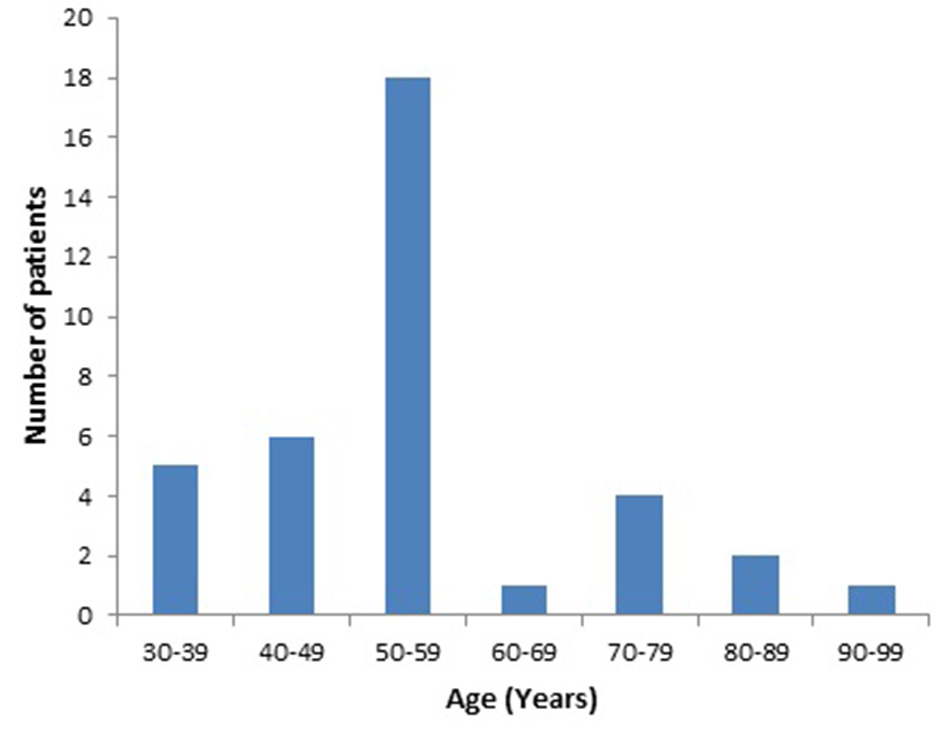
Figure 1. Age distribution of patients with cognitive impairment.
| Journal of Clinical Medicine Research, ISSN 1918-3003 print, 1918-3011 online, Open Access |
| Article copyright, the authors; Journal compilation copyright, J Clin Med Res and Elmer Press Inc |
| Journal website http://www.jocmr.org |
Original Article
Volume 12, Number 4, April 2020, pages 255-265
Cognitive Function Assessment in Patients on Moderate- or High-Intensity Statin Therapy
Figures
Tables
| Variable | All patients (n = 213) | (A) Patients on MIST with normal cognitive function (n = 133) | (B) Patients on MIST with cognitive impairment (n = 8) | P (A vs. B) | (C) Patients on HIST with normal cognitive function (n = 42) | (D) Patients on HIST with cognitive impairment (n = 30) | P (C vs. D) | P (B vs. D) |
|---|---|---|---|---|---|---|---|---|
| MIST: moderate-intensity statin therapy; HIST: high-intensity statin therapy; SD: standard deviation; LDL: low-density lipoprotein; HDL: high-density lipoprotein; TG: triglyceride; BP: blood pressure. | ||||||||
| Age, years, mean (SD) | 55.4 (12.9) | 53.9 (12.6) | 47.3 (12.2) | 0.150 | 59.7 (11.5) | 53.4 (14.4) | 0.655 | 0.053 |
| Gender | ||||||||
| Male, n (%) | 124 (58.2%) | 74 (55.6%) | 3 (37.5%) | 0.468 | 29 (69%) | 18 (60%) | 0.461 | 0.426 |
| Female, n (%) | 89 (41.8%) | 59 (55.6%) | 5 (62.5%) | 13 (31%) | 12 (40%) | |||
| Race | ||||||||
| Caucasian, n (%) | 78 (36.6%) | 49 (36.8%) | 3 (37.5%) | 0.889 | 19 (45.2%) | 7 (23.3%) | 0.214 | 0.796 |
| African-American, n (%) | 67 (31.5%) | 44 (33.1%) | 3 (37.5%) | 9 (21.4%) | 11 (36.7%) | |||
| Hispanic, n (%) | 30 (14.1%) | 10 (7.5%) | 1 (12.5%) | 11 (26.2%) | 8 (26.7%) | |||
| Other/Asian, n (%) | 38 (17.8%) | 30 (22.6%) | 1 (12.5%) | 3 (7.1%) | 4 (13.3%) | |||
| Education | ||||||||
| Beyond high school (> 12) | 104 (48.8%) | 58 (43.6%) | 7 (87.5%) | 0.024 | 22 (52.4%) | 22 (73.3%) | 0.072 | 0.650 |
| High school or less (0 - 12) | 109 (51.2%) | 75(56.7%) | 1 (12.5%) | 20 (47.6%) | 8 (26.7%) | |||
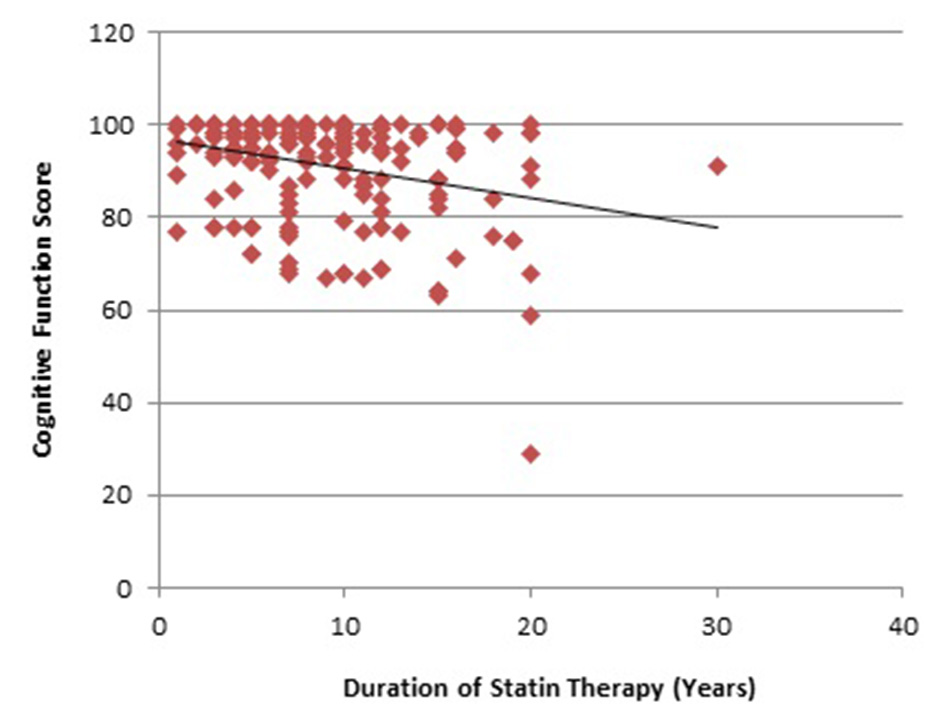
| Duration of statin therapy | ||||||||
| Less than 5 years, n (%) | 36 (16.9%) | 21 (15.8%) | 3 (37.5%) | 0.272 | 11 (26.2%) | 1 (3.3%) | 0.032 | 0.008 |
| 5 - 10 years, n (%) | 113 (53.1%) | 82 (61.7%) | 4 (50%) | 15 (35.7%) | 12 (40%) | |||
| More than 10 years, n (%) | 64 (30%) | 30 (22.6%) | 1 (12.5%) | 16 (38.1%) | 17 (56.7%) | |||
| Vitals | ||||||||
| Systolic BP (mm Hg), mean (SD) | 128 (13.9) | 128.1 (13.4) | 125.9 (14.4) | 0.658 | 128.1 (14.3) | 132.1 (13.8) | 0.238 | 0.269 |
| Diastolic BP (mm Hg), mean (SD) | 77.9 (9.5) | 78.2 (9.5) | 74.9 (10) | 0.325 | 77.3 (10.6) | 78.2 (9.2) | 0.715 | 0.383 |
| Lipids | ||||||||
| Total cholesterol (mg/dL), mean (SD) | 170.7 (38.6) | 166.6 (36.8) | 195.38(29.8) | 0.032 | 169.3 (41.5) | 184.3 (41.3) | 0.130 | 0.485 |
| LDL (mg/dL), mean (SD) | 88.2 (31.9) | 84.1 (29.5) | 114.5 (29.8) | 0.005 | 90.9 (33.5) | 96.2 (23.4) | 0.528 | 0.203 |
| HDL (mg/dL), mean (SD) | 49.4 (12.3) | 49.3 (11.9) | 53.5 (11.3) | 0.335 | 47 (13.5) | 51.8 (14.4) | 0.124 | 0.728 |
| TG (mg/dL), mean (SD) | 169.9 (91) | 169.5 (90.7) | 136.63 (49.1) | 0.313 | 162.5 (75.9) | 190.9 (114.4) | 0.242 | 0.056 |
| Medical comorbidity | All patients (n = 213) | (A) Patients on MIST with normal cognitive function (n = 133) | (B) Patients on MIST with cognitive impairment (n = 8) | P (A vs. B) | (C) Patients on HIST with normal cognitive function (n = 42) | (D) Patients on HIST with cognitive impairment (n = 30) | P (C vs. D) | P (B vs. D) |
|---|---|---|---|---|---|---|---|---|
| MIST: moderate-intensity statin therapy; HIST: high-intensity statin therapy; CAD: coronary artery disease; CVA: cerebrovascular accident; CHF: congestive heart failure; COPD: chronic obstructive pulmonary disease; CKD: chronic kidney disease; OSA: obstructive sleep apnea. | ||||||||
| Hypertension, n (%) | 168 (79.2%) | 106 (80.3%) | 2 (25%) | 0.002 | 34 (58.2%) | 26 (86.7%) | 0.750 | 0.002 |
| Diabetes mellitus, n (%) | 167 (78.4%) | 110 (82.7%) | 6 (75%) | 0.632 | 25 (59.5%) | 26 (86.7%) | 0.012 | 0.587 |
| Hypothyroidism, n (%) | 29 (13.6%) | 19 (14.3%) | 0 (0%) | 0.598 | 6 (14.3%) | 4(13.3%) | 1.000 | 0.560 |
| Depression, n (%) | 42 (19.8%) | 25 (18.8%) | 3 (37.5%) | 0.195 | 9 (21.4%) | 5(16.7%) | 0.765 | 0.327 |
| CAD, n (%) | 31 (14.6%) | 18 (13.4%) | 0 (0%) | 0.596 | 7 (16.7%) | 6 (20%) | 0.717 | 0.309 |
| CVA, n (%) | 18 (8.5%) | 4 (3%) | 0 (0%) | 1.000 | 8 (19%) | 6 (20%) | 0.920 | 0.309 |
| CHF, n (%) | 8 (3.8%) | 7 (5.3%) | 0 (0%) | 1.000 | 0 (0%) | 1 (3.3%) | 0.417 | 1.000 |
| COPD, n (%) | 13 (6.1%) | 9 (6.8%) | 0 (0%) | 1.000 | 2 (4.8%) | 2 (6.7%) | 1.000 | 1.000 |
| CKD, n (%) | 17 (8%) | 18 (6%) | 0 (0%) | 1.000 | 4 (9.5%) | 5 (16.7%) | 0.476 | 0.563 |
| Anemia, n (%) | 23 (10.8%) | 12 (9%) | 0 (0%) | 1.000 | 8 (19%) | 3 (10%) | 0.341 | 1.000 |
| Arthritis, n (%) | 42 (19.9%) | 23 (17.6%) | 0 (0%) | 0.352 | 9 (21.4%) | 10 (33%) | 0.258 | 0.082 |
| Malignancy, n (%) | 9 (4.2%) | 7 (5.3%) | 0 (0%) | 1.000 | 1 (2.4%) | 1 (3.3%) | 1.000 | 1.000 |
| OSA, n (%) | 29 (13.6%) | 18 (6%) | 1 (12.5%) | 1.000 | 5 (11.9%) | 5(16.7%) | 0.732 | 1.000 |
| Daily statin | All patients (n = 213) | (A) Patients on MIST with normal cognitive function (n = 133) | (B) Patients on MIST with cognitive impairment (n = 8) | P (A vs. B) | (C) Patients on HIST with normal cognitive function (n = 42) | (D) Patients on HIST with cognitive impairment (n = 30) | P (C vs. D) |
|---|---|---|---|---|---|---|---|
| MIST: moderate-intensity statin therapy; HIST: high-intensity statin therapy; BID: twice a day. | |||||||
| Atorvastatin 40 - 80 mg, n (%) | 50 (23.5%) | 30 (71.3%) | 20 (66.7%) | 0.796 | |||
| Rosuvastatin 20 - 40 mg, n (%) | 22 (10.3%) | 12 (28.7%) | 10 (33.3%) | 0.665 | |||
| Atorvastatin 10 - 20 mg, n (%) | 40 (18.8%) | 36 (27.1%) | 4 (50%) | 0.217 | |||
| Rosuvastatin 10 mg, n (%) | 23 (10.8%) | 21 (15.8%) | 2 (25%) | 0.617 | |||
| Simvastatin 20 - 40 mg, n (%) | 40 (18.8%) | 39 (29.3%) | 1 (12.5%) | 0.440 | |||
| Pravastatin 40 - 80 mg, n (%) | 13 (6.1%) | 12 (9%) | 1 (12.5%) | 0.548 | |||
| Lovastatin 40 mg, n (%) | 8 (3.8%) | 8 (6%) | 0 (0%) | 1.000 | |||
| Fluvastatin XL 80 mg, n (%) | 6 (2.8%) | 6 (4.5%) | 0 (0%) | 1.000 | |||
| Fluvastatin 40 mg BID, n (%) | 4 (1.9%) | 4 (3%) | 0 (0%) | 1.000 | |||
| Pitavastatin 2 - 4 mg, n (%) | 7 (3.3%) | 7 (5.3%) | 0 (0%) | 1.000 | |||