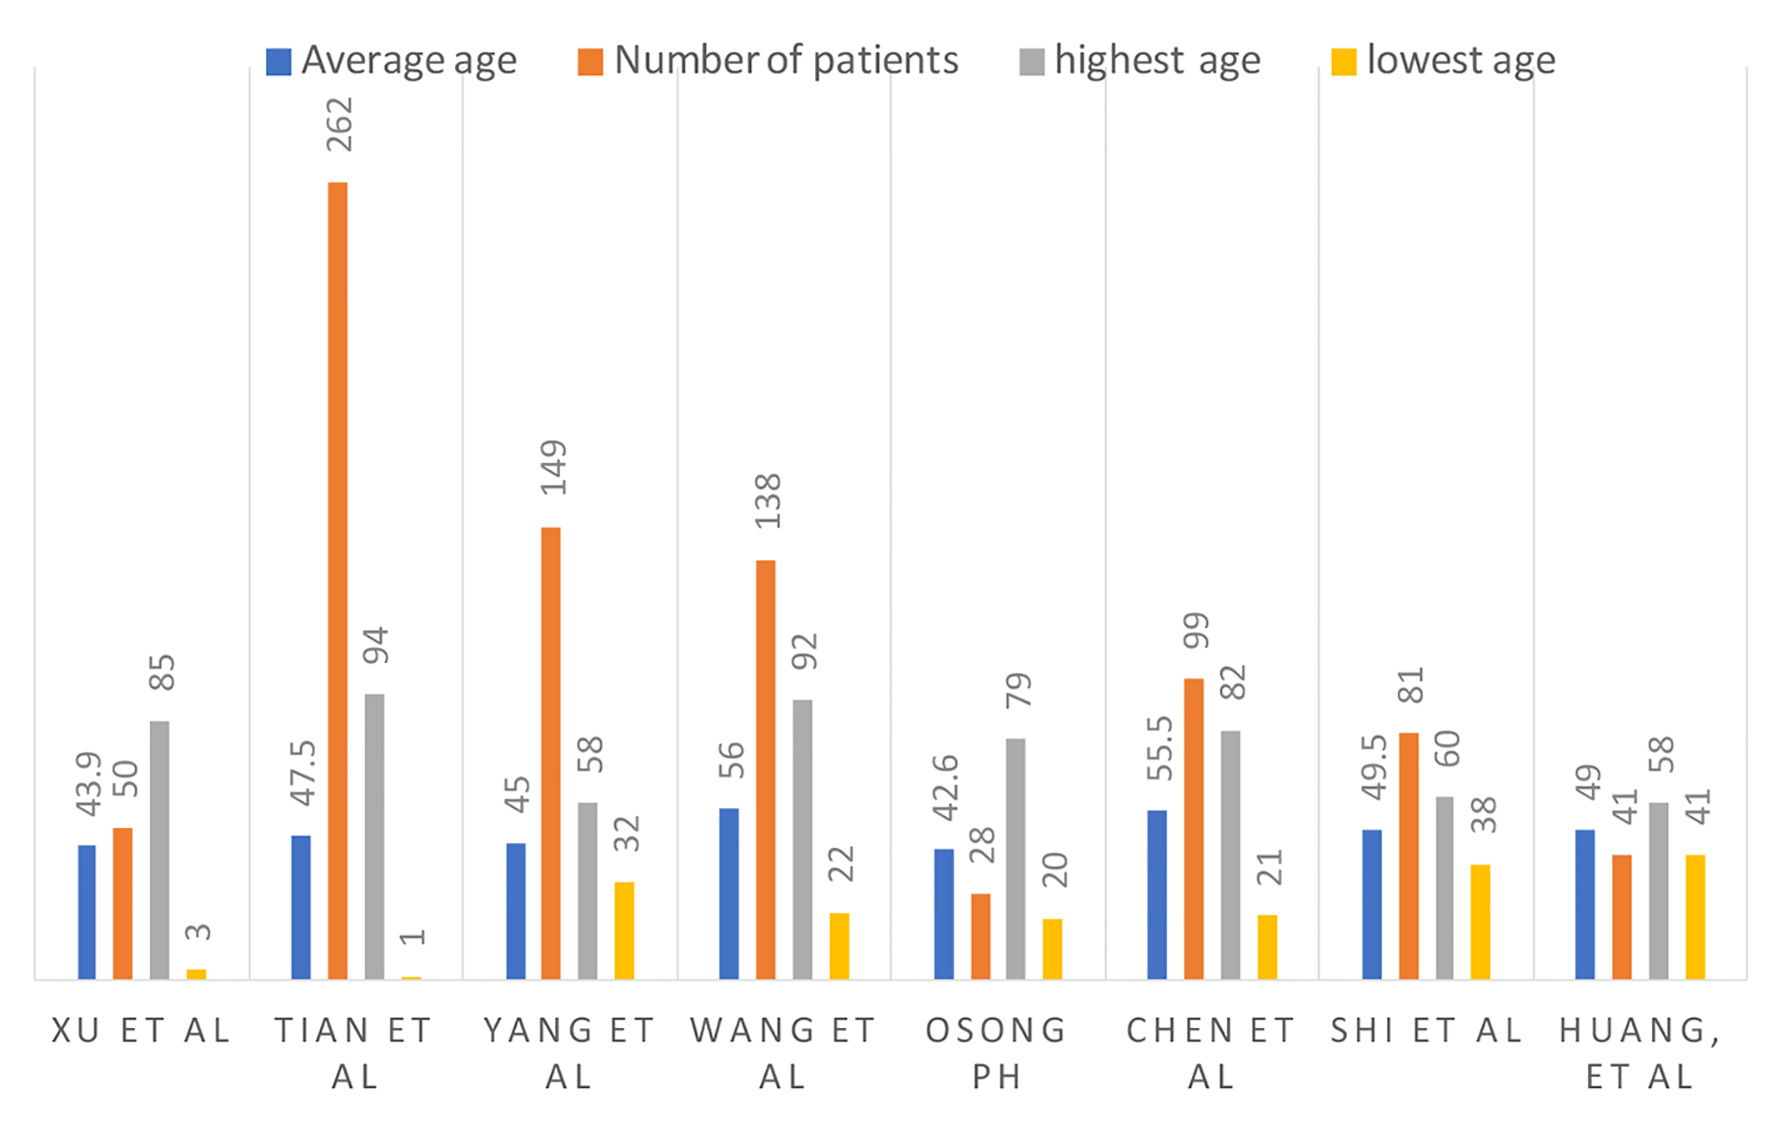
Figure 1. Number of patients, average age and age range.
| Journal of Clinical Medicine Research, ISSN 1918-3003 print, 1918-3011 online, Open Access |
| Article copyright, the authors; Journal compilation copyright, J Clin Med Res and Elmer Press Inc |
| Journal website http://www.jocmr.org |
Review
Volume 12, Number 4, April 2020, pages 215-229
COVID-19, Modern Pandemic: A Systematic Review From Front-Line Health Care Providers’ Perspective
Figures
Tables
| Groups | Duration of symptoms | CT chest findings |
|---|---|---|
| CT: computed tomography. | ||
| Group 1 | Subclinical | Unilateral ground-glass opacities |
| Group 2 | Less than 1 week | Bilateral ground-glass opacities |
| Group 3 | 1 - 2 weeks | Decrease in ground-glass opacities |
| Group 4 | 2 - 3 weeks | Consolidation and mixed patterns |
| Study | Number of patients (n) | Co-morbid conditions | Mortality |
|---|---|---|---|
| HTN: hypertension; DM: diabetes mellitus; CVD: cardiovascular disease; CKD: chronic kidney disease; NA: not available. | |||
| Guan et al [31] | 1,099 | HTN: 165 (15%) CVD: 27 (2.5%) DM: 81 (7.4%) CKD: 8 (0.7%) | 15 (0.4) |
| Huang et al [14] | 41 | HTN: 6 (15%) CVD: 6 (15%) DM: 8 (20%) CKD: NA | 6 (15%) |
| Chen et al [15] | 99 | HTN: NA CVD: 40 (40%) DM: 12 (12%) CKD: NA | 11 (11%) |
| For in-hospital mortality, score 0 - 11 is low risk, score greater than or equal to 12 is high risk. | |
| Multilobar infiltrate | 5 points |
| Lymphocyte count less than 0.8 × 10⁹/L | 4 points |
| Bacterial coinfection | 4 points |
| Acute smoker | 3 points |
| Hypertension | 2 points |
| Age greater than or equal to 60 | 2 points |
| Yu-Huan Xu et al classification | |
| Mild | Mild clinical symptoms, no imaging presentation of pneumonia |
| Common | Fever, respiratory symptoms, imaging confirming pneumonia |
| Severe | Respiratory distress with a respiratory rate greater than 30, oxygen saturations < 93% at rest and PaO2/FiO2 < 300 |
| Critically severe | Respiratory failure with intubation, shock, organ failure requiring care in intensive care unit |
| Tian et al classification | |
| Non-pneumonia | Confirmed case with fever and/or respiratory symptoms, but no radiographic evidence of pneumonia |
| Mild | Confirmed case with fever, respiratory symptoms and radiographic evidence of pneumonia |
| Severe | Mild case with dyspnea and respiratory failure |
| Drug | Mechanism of action | Dose and frequency | Mode of administration |
|---|---|---|---|
| Vitamin A, B, C, D, E, thymosin alpha-1, thymopentin | Antioxidants/enhance immunity | Oral | |
| Selenium, zinc and pyrithione combination | Enhance immunity | Oral | |
| Interferon-β | Inhibit the replication of SARS-CoV and MERS-CoV replication | Sub-cutaneous | |
| Interferon-α | Inhibit the replication of SARS-CoV and MERS-CoV replication | 5 million U twice a day for a maximum of 10 days | Inhalation |
| Chloroquine | Spike (S)-protein angiotensin-converting enzyme 2 (ACE-2) blockers | 500 mg twice daily for a maximum of 10 days | Oral |
| Mefloquine | Unknown | N/A | Oral |
| Favipiravir | RNA-dependent RNA polymerase (RdRp) inhibitor | Proposed dose, 600 mg tid with 1,600 mg first loading dosage for a maximum of 14 days | Oral |
| Remdesivir | RdRp inhibitor | 200 mg on day 1 followed by 100 mg daily for 9 days | Intravenous |
| Darunavir | Protease inhibitor | 800 mg daily | Oral |
| Lopinavir/ritonavir | Protease inhibitor | 200 mg/50 mg, two capsules twice a day for a maximum of 10 days | Oral |
| Ribavirin | Nucleoside analogue | 500 mg, 2 to 3 times per day | Intravenous infusion in combination with lopinavir/ritonavir + interferon-α |
| Arbidol | 200 mg three times a day for a maximum of 10 days | Oral | |
| Type II transmembrane serine protease (TMSPSS2) inhibitors (Brand - Camostat) | TMSPSS2 inhibitors | Oral |
| R0: metric in epidemiology used to describe the transmissibility of infectious agents; Rt: reproduction number at a particular point of time. | |
| Phase 1 | An early phase of the epidemic when few prevention and control measures were implemented. R0 was 3.1. |
| Phase 2 | Public transportation to and from Wuhan, as well as public transportation within Wuhan, were stopped. While gathering events inside Wuhan was banned, quarantine and isolation were gradually established in Wuhan. Rt was 2.6. |
| Phase 3 | New infectious disease hospitals and mobile cabin hospitals came into service, and many medical and public health teams from other provinces and cities in China arrived in Wuhan. The quarantine and isolation at the community level were further enhanced. Rt decreased to 1.9. |
| Phase 4 | The peak of public health restrictions in Wuhan, China. Rt became 0.9. |