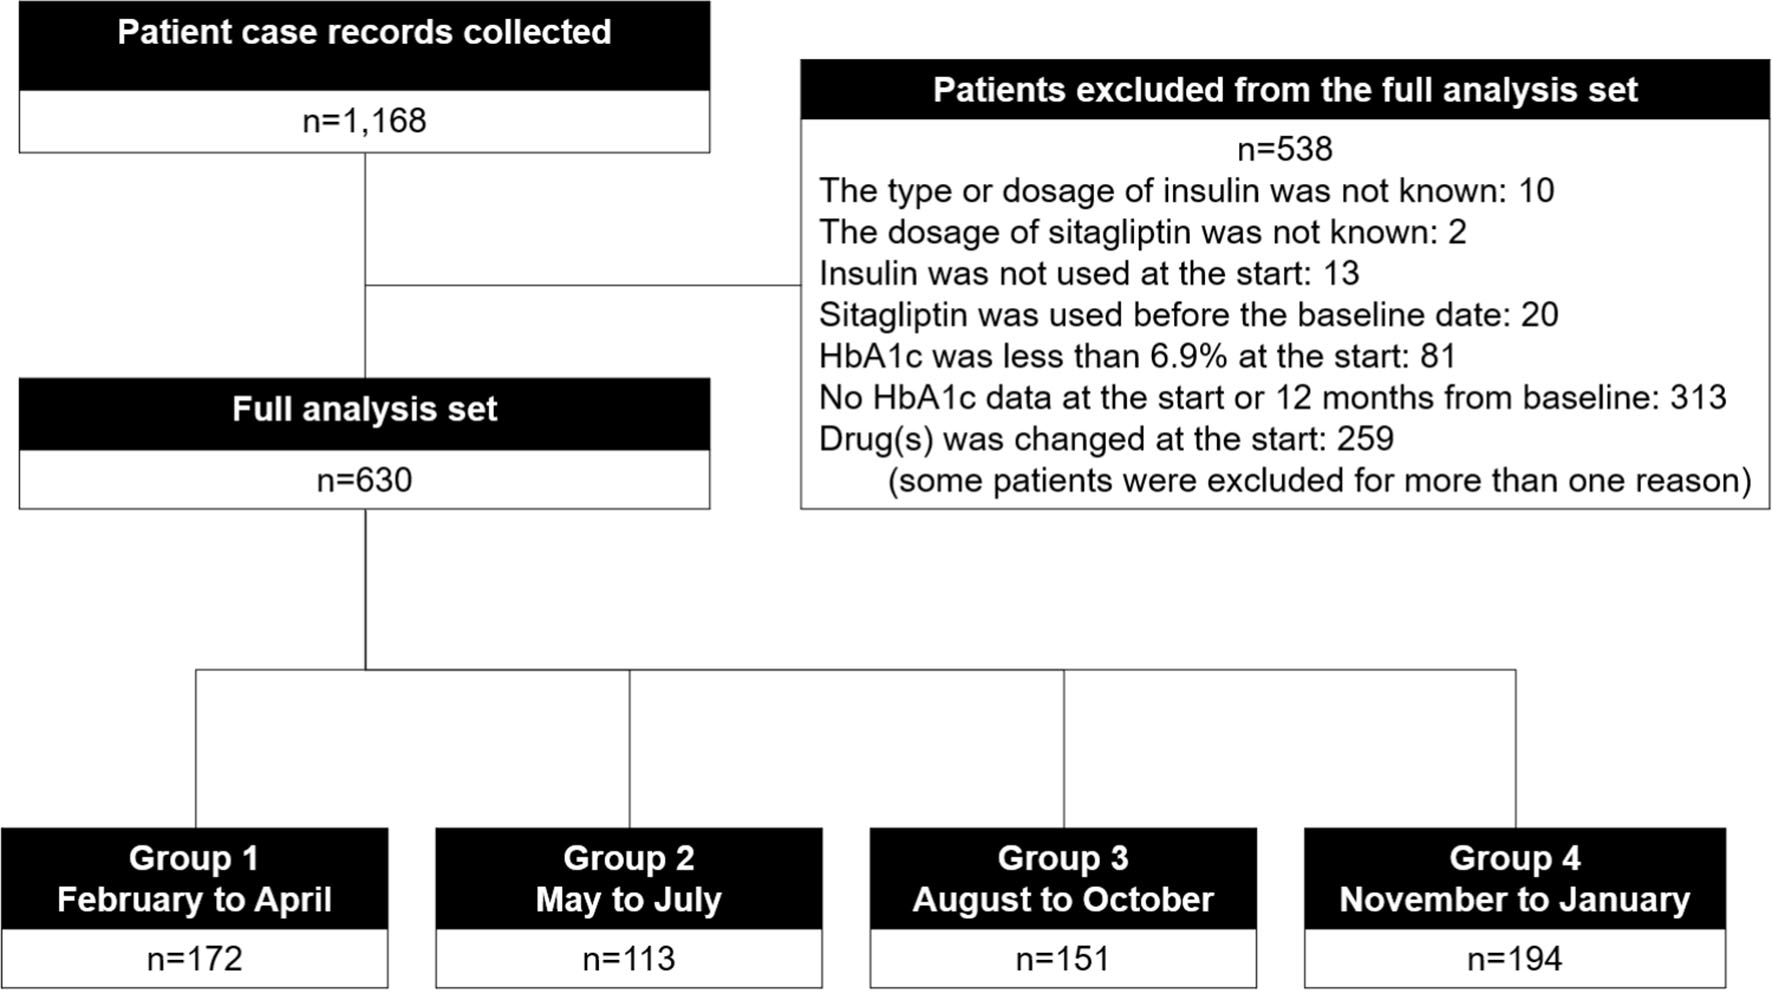
Figure 1. Participant flow.
| Journal of Clinical Medicine Research, ISSN 1918-3003 print, 1918-3011 online, Open Access |
| Article copyright, the authors; Journal compilation copyright, J Clin Med Res and Elmer Press Inc |
| Journal website http://www.jocmr.org |
Original Article
Volume 12, Number 3, March 2020, pages 200-208
A Study of Seasonal Variation in the Effect of Add-On Sitagliptin on Blood Glucose Control in Insulin-Treated Patients With Type 2 Diabetes
Figures
Tables
| Item | Group 1 | Group 2 | Group 3 | Group 4 | P |
|---|---|---|---|---|---|
| Data are presented as number (%) or mean ± SD. BMI: body mass index; SBP: systolic blood pressure; DBP: diastolic blood pressure; eGFR: estimated glomerular filtration rate; LDL-C: low-density lipoprotein cholesterol; HDL-C: high-density lipoprotein cholesterol; TG: triglyceride; GOT: glutamate oxaloacetate transaminase; GPT: glutamate pyruvate transaminase; γ-GTP: γ-glutamyl transpeptidase; BUN: blood urea nitrogen; HbA1c: hemoglobin A1c; SD: standard deviation. *P < 0.05 ANOVA; **P < 0.05 Chi-squared test. | |||||
| N | 172 | 113 | 151 | 194 | |
| Age, years | 67.1 ± 10.4 | 64.4 ± 10.0 | 63.4 ± 12.1 | 63.0 ± 12.8 | 0.003* |
| Men/women | 92 (53.5%)/80 (46.5%) | 51 (45.1%)/62 (54.9%) | 73 (48.3%)/78 (51.7%) | 79 (40.7%)/115 (59.3%) | 0.101 |
| Disease duration, years | 17.7 ± 9.1 | 17.2 ± 10.1 | 16.9 ± 8.5 | 16.6 ± 8.9 | 0.731 |
| Retinopathy | 58 (66.3%) | 37 (67.3%) | 60 (60.3%) | 63 (67.5%) | 0.498 |
| Cataract | 34 (80.2%) | 22 (80.5%) | 24 (84.1%) | 41 (78.9%) | 0.666 |
| Neuropathy | 63 (63.4%) | 35 (69%) | 52 (65.6%) | 66 (66%) | 0.807 |
| Nephropathy | 69 (59.9%) | 49 (56.6%) | 59 (60.9%) | 76 (60.8%) | 0.888 |
| Cerebrovascular disorder | 18 (89.5%) | 9 (92%) | 14 (90.7%) | 15 (92.3%) | 0.803 |
| Myocardial infarction and angina | 29 (83.1%) | 18 (84.1%) | 23 (84.8%) | 44 (77.3%) | 0.249 |
| Arteriosclerosis obliterans | 19 (89%) | 8 (92.9%) | 11 (92.7%) | 22 (88.7%) | 0.412 |
| Hypertension | 90 (47.7%) | 71 (37.2%) | 86 (43%) | 116 (40.2%) | 0.304 |
| Dyslipidemia | 97 (43.6%) | 73 (35.4%) | 105 (30.5%) | 126 (35.1%) | 0.095 |
| Fatty liver | 46 (73.3%) | 45 (60.2%) | 44 (70.9%) | 71 (63.4%) | 0.055 |
| Medication information | |||||
| Dosage of sitagliptin | |||||
| 25 mg/day | 36 (20.9%) | 29 (25.7%) | 24 (15.9%) | 27 (13.9%) | 0.226 |
| 50 mg/day | 135 (78.5%) | 83 (73.5%) | 126 (83.4%) | 166 (85.6%) | |
| 100 mg/day | 1 (0.6%) | 1 (0.9%) | 1 (0.7%) | 1 (0.5%) | |
| Classification of insulin | |||||
| Three times or more (no long-acting type) | 39 (22.7%) | 23 (20.4%) | 27 (17.9%) | 49 (25.3%) | 0.410 |
| Three times or more (including a long-acting type) | 60 (34.9%) | 51 (45.1%) | 57 (37.7%) | 59 (30.4%) | |
| Twice, mixed type | 30 (17.4%) | 14 (12.4%) | 28 (18.5%) | 37 (19.1%) | |
| Administered once, long-acting type | 28 (16.3%) | 21 (18.6%) | 30 (19.9%) | 37 (19.1%) | |
| Others | 15 (8.7%) | 4 (3.5%) | 9 (6%) | 12 (6.2%) | |
| Number of insulin administrations | 2.7 ± 1.1 | 2.9 ± 1.1 | 2.7 ± 1.1 | 2.6 ± 1.0 | 0.197 |
| Total amount of insulin administered, U/day | 30.2 ± 23.0 | 33.3 ± 22.2 | 33.8 ± 21.5 | 32.1 ± 21.7 | 0.473 |
| Previous treatment with insulin, years | 6.9 ± 6.1 | 7.3 ± 6.9 | 6.7 ± 4.8 | 6.0 ± 4.9 | 0.341 |
| Concomitant medications | |||||
| Sulfonylurea | 25 (85.5%) | 16 (85.8%) | 38 (74.8%) | 41 (78.9%) | 0.041** |
| Biguanide | 59 (65.7%) | 40 (64.6%) | 67 (55.6%) | 81 (58.2%) | 0.200 |
| α-Glucosidase inhibitors | 38 (77.9%) | 17 (85%) | 25 (83.4%) | 49 (74.7%) | 0.091 |
| Thiazolidine | 12 (93%) | 6 (94.7%) | 15 (90.1%) | 10 (94.8%) | 0.313 |
| Laboratory data at the start of sitagliptin | |||||
| HbA1c, % | 8.53 ± 1.24 | 8.56 ± 1.25 | 8.70 ± 1.31 | 8.73 ± 1.32 | 0.404 |
| Fasting blood glucose, mg/dL | 202.3 ± 67.2 | 169.4 ± 50.6 | 178.1 ± 77.7 | 194.4 ± 73.5 | 0.098 |
| Casual blood glucose, mg/dL | 195.9 ± 86.8 | 195.1 ± 94.8 | 194.7 ± 71.8 | 207.4 ± 84.7 | 0.516 |
| BMI, kg/m2 | 24.19 ± 3.82 | 25.40 ± 4.94 | 26.05 ± 4.31 | 25.75 ± 4.66 | < 0.001* |
| SBP, mm Hg | 131.6 ± 13.2 | 128.4 ± 14.2 | 130.7 ± 15.8 | 131.1 ± 17.2 | 0.396 |
| DBP, mm Hg | 74.2 ± 9.3 | 72.0 ± 10.2 | 75.4 ± 12.0 | 76.2 ± 10.9 | 0.011* |
| eGFR, mL/min/1.73 m2 | 77.1 ± 21.8 | 76.1 ± 23.6 | 75.5 ± 21.8 | 75.9 ± 24.3 | 0.957 |
| LDL-C, mg/dL | 110.7 ± 25.1 | 109.6 ± 29.6 | 108.1 ± 30.3 | 106.3 ± 29.6 | 0.623 |
| HDL-C, mg/dL | 60.6 ± 15.0 | 54.2 ± 18.2 | 53.5 ± 14.9 | 54.3 ± 14.6 | < 0.001* |
| TG, mg/dL | 151.1 ± 127.2 | 163.9 ± 132.8 | 173.5 ± 96.2 | 176.7 ± 117.7 | 0.246 |
| GOT, U/L | 25.2 ± 15.7 | 24.2 ± 18.0 | 25.0 ± 12.1 | 24.5 ± 15.6 | 0.960 |
| GPT, U/L | 26.3 ± 20.9 | 27.5 ± 21.1 | 30.6 ± 22.0 | 27.1 ± 19.0 | 0.383 |
| γ-GTP, U/L | 46.8 ± 80.5 | 45.4 ± 44.6 | 45.4 ± 40.0 | 43.7 ± 54.8 | 0.978 |
| BUN, mg/dL | 18.3 ± 5.5 | 15.4 ± 4.4 | 16.3 ± 5.1 | 15.5 ± 4.9 | 0.002* |
| Uric acid, mg/dL | 4.9 ± 1.3 | 5.1 ± 1.3 | 5.2 ± 1.5 | 5.0 ± 1.4 | 0.711 |
| n | 0 - 3 months | 4 - 6 months | 7 - 9 months | 10 - 12 months | By 12 months from baseline | |
|---|---|---|---|---|---|---|
| Data are n (%). N.S. Chi-squared test. N.S.: no significance. | ||||||
| Group 1 | 172 | 17 (9.9%) | 8 (4.7%) | 9 (5.2%) | 8 (4.7%) | 25 (14.5%) |
| Group 2 | 113 | 10 (8.8%) | 5 (4.4%) | 6 (5.3%) | 4 (3.5%) | 16 (14.2%) |
| Group 3 | 151 | 4 (2.6%) | 0 (0%) | 3 (2.0%) | 6 (4.0%) | 12 (7.9%) |
| Group 4 | 194 | 13 (6.7%) | 10 (5.2%) | 8 (4.1%) | 11 (5.7%) | 23 (11.9%) |
| P | 0.094 | 0.054 | 0.444 | 0.818 | 0.275 | |