Journal of Clinical Medicine Research, ISSN 1918-3003 print, 1918-3011 online, Open Access
Article copyright, the authors; Journal compilation copyright, J Clin Med Res and Elmer Press Inc
Journal website http://www.jocmr.org

Original Article

Volume 12, Number 2, February 2020, pages 115-121


Medical and Dental Visits of Chronic Kidney Disease-Diagnosed Participants Analyzed From the Specific Health Checkups Results in Japan: TAMA MED Project-CKD

Figures

Figure 1.
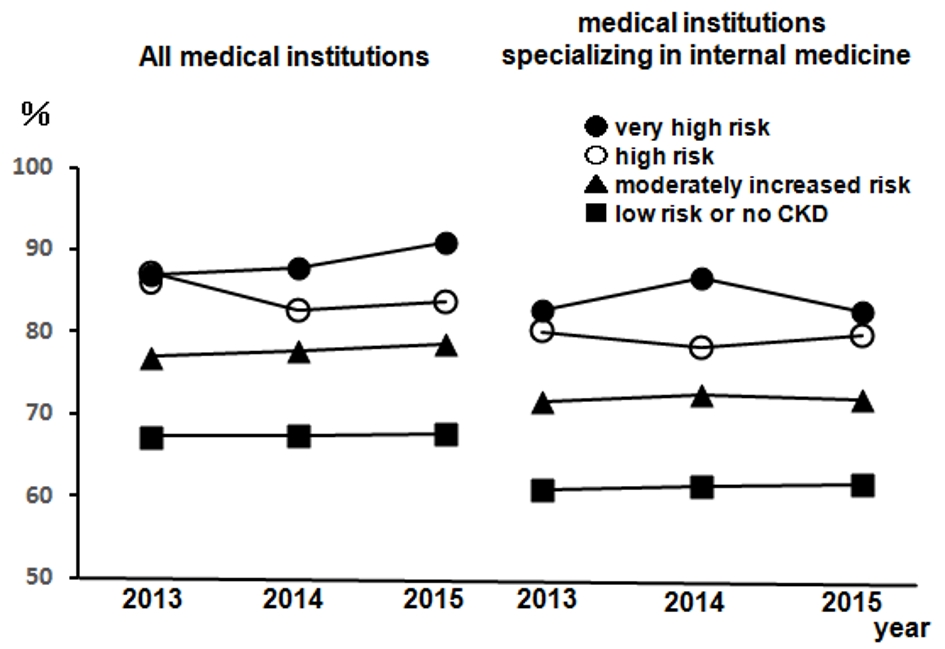
Figure 1. The rates of regular visits at medical institutions of participants undergoing health checkups from 2013 to 2015. Left: all medical institutions; right: medical institutions specializing in internal medicine. •: very high risk; ○: high risk; ▲: moderately increased risk; ■: low risk or no CKD. n = 12,732 (2013), n = 14,150 (2014), and n = 12,274 (2015). CKD: chronic kidney disease.
Figure 2.
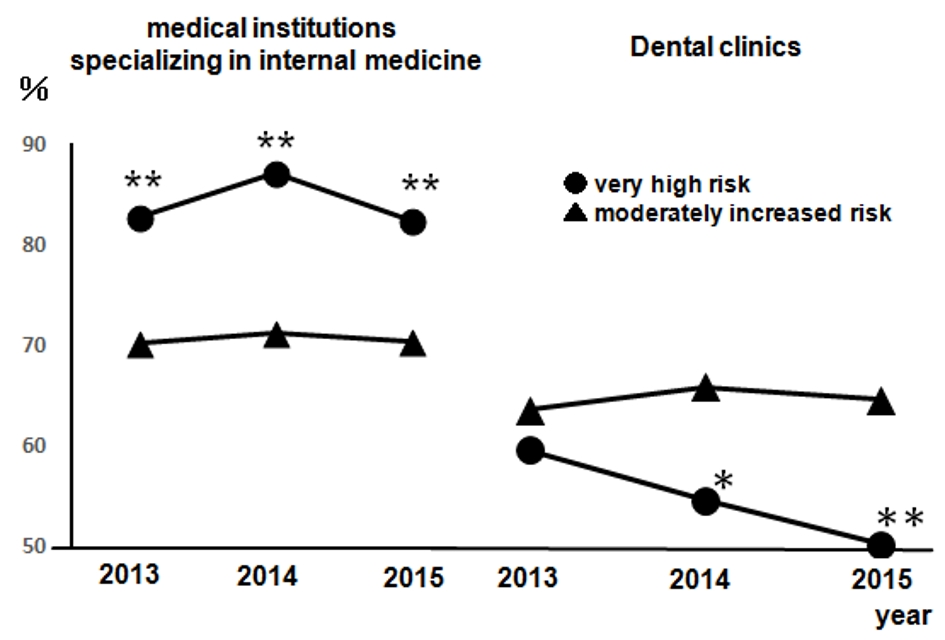
Figure 2. The rates of dental visits of CKD-diagnosed participants from 2013 to 2015 compared to the rates of regular visits at medical institutions specializing in internal medicine. Left: medical institutions specializing in internal medicine; right: dental clinics. •: very high risk; ▲: moderately increased risk. Very high risk: n = 141 (2013), n = 127 (2014), and n = 115 (2015); moderately increased risk: n = 2,056 (2013), n = 2,044 (2014), and n = 1,981 (2015). *P < 0.05; **P < 0.01 versus moderately increased risk. CKD: chronic kidney disease.
Figure 3.
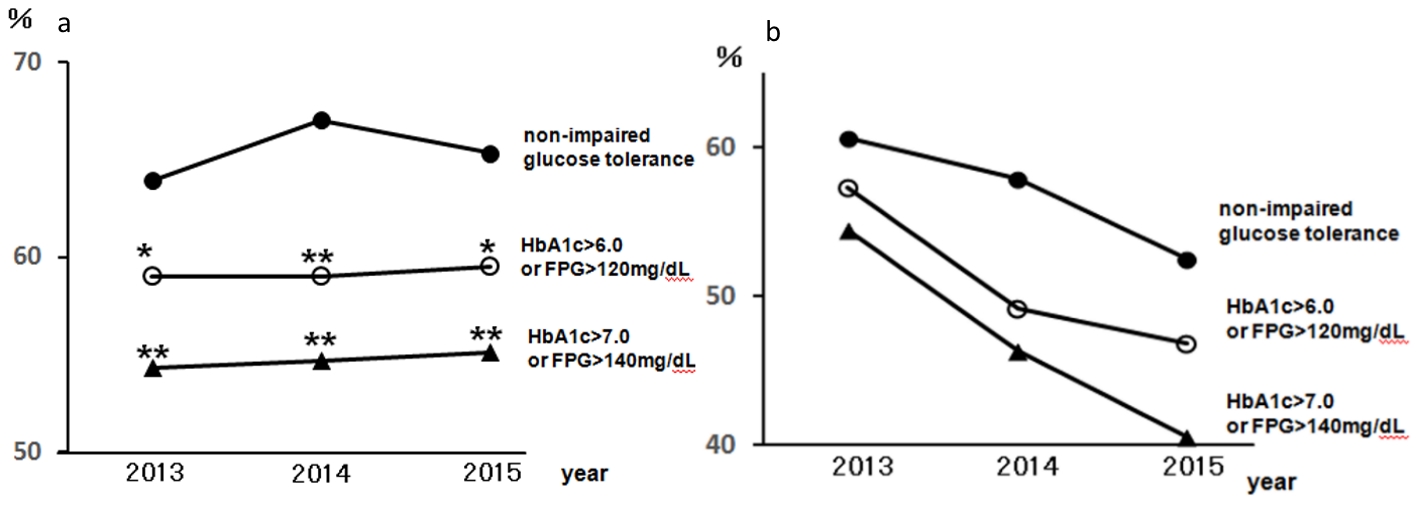
Figure 3. The rates of dental visits of CKD-diagnosed participants depending on the degree of impaired glucose tolerance from 2013 to 2015. (a) The rates of dental visits of CKD moderately increased risk group. •: Moderately increased risk with HbA1c ≤ 6.0 and FPG ≤ 120 mg/dL and not receiving medical treatment for diabetes: non-impaired glucose tolerance; ○: moderately increased risk with HbA1c > 6.0 or FPG > 120 mg/dL; ▲: moderately increased risk with HbA1c > 7.0 or FPG > 140 mg/dL. *P < 0.05; **P < 0.01 versus non-impaired glucose tolerance. (b) The rates of dental visits of CKD very high risk group. •: very high risk with HbA1c ≤ 6.0 and FPG ≤ 12 0 mg/dL and not receiving medical treatment for diabetes: non-impaired glucose tolerance; ○: very high risk with HbA1c > 6.0 or FPG > 120 mg/dL; ▲: very high risk with HbA1c > 7.0 or FPG > 140 mg/dL. CKD: chronic kidney disease; HbA1c: hemoglobin A1c; FPG: fasting plasma glucose.

Tables

Table 1. Characteristics of Participants
 
Data are given as n (%) or mean ± SD. BMI: body mass index; BP: blood pressure; TIA: transient ischemic attack; HDL-C: high-density lipoprotein cholesterol; LDL-C: low-density lipoprotein cholesterol; NGSP: National Glycohemoglobin Standardization Program; JDS: Japan Diabetes Society; AF: atrial fibrillation; EKG: electrocardiogram. aCardiac disease was self-reported. bHbA1c (JDS) + 0.4%.
Number of subjects12,303
Age (years)67.0 ± 7.3
Sex: men, women (%)5,034 (40.9), 7,269 (59.1)
BMI (kg/m2)22.6 ± 3.3
Systolic BP (mm Hg)127.2 ± 16.5
Diastolic BP (mm Hg)74.5 ± 10.4
Current smoker2,697 (22.2)
Comorbidities
  Cardiac diseasea749 (6.1)
  Hypertension5,235 (42.6)
  Diabetes mellitus1,603 (13.0)
  Stroke/TIA488 (4.0)
  Metabolic syndrome1,837 (14.9)
Blood examinations
  HDL-C (mg/dL)64.5 ± 16.6
  LDL-C (mg/dL)124.6 ± 30.4
  Triglycerides (mg/dL)114.4 ± 80.1
  HbA1c (NGSP)b (%)5.7 ± 0.6
Urinalysis
  Urine sugar280 (2.3)
  Urine protein517 (4.2)
EKG
  AF175 (1.4)
Medications
  For hypertension4,206 (34.2)
  For diabetes mellitus1,011 (8.2)
  For dyslipidemia2,693 (21.9)


Table 2. Classification of CKD-Diagnosed Participants That Attended Checkups in 2015
 
GFR stageeGFR (mL/min/1.73m2)Proteinuria (-) or (±)Proteinuria (+)Proteinuria (++) or (+++)Unknown
Red: very high risk; orange: high risk; yellow: moderately increased risk; green: low risk or no CKD.
G1 (risk)≥ 901,264 (green)46 (yellow)10 (orange)5
G2 (risk)60 - 898,597 (green)217 (yellow)52 (orange)9
G3a (risk)45 - 591,718 (yellow)85 (orange)38 (red)1
G3b (risk)30 - 44170 (orange)24 (red)17 (red)0
G4 (risk)15 - 298 (red)9 (red)15 (red)0
G5 (risk)< 150 (red)2 (red)2 (red)14 (dialysis)


Table 3. Amount of People With Risk Factors for Lifestyle Diseases That Attended Checkups in 2015
 
GFR stageHTDMHLBMI ≥ 25BMI < 18.5Smoking
AllMedication (-)AllMedication (-)AllMedication (-)
Hypertension was defined by a systolic BP ≥ 140 mm Hg and/or receiving antihypertensive medication; diabetes mellitus was defined by an FPG ≥ 126 mg/dL or HbA1c ≥ 6.5% (NGSP), and/or receiving medical treatment with oral hypoglycemic agents and/or insulin; hyperlipidemia was defined by an LDL-C ≥ 140 mg/dL and/or receiving antihyperlipidemic medication. BP: blood pressure; HT: hypertension; DM: diabetes mellitus; HL: hyperlipidemia; BMI: body mass index; NGSP: National Glycohemoglobin Standardization Program; GFR: glomerular filtration rate; FPG: fasting plasma glucose; LDL-C: low-density lipoprotein cholesterol.
G1 ( n = 1,325)518 (39.0%)135 (10.2%)190 (14.3%)123 (9.3%)517 (39.0%)282 (21.3%)247 (18.6%)172 (13.0%)365 (27.5%)
G2 (n = 8,875)3,848 (43.4%)1,027 (11.6%)1,038 (11.7%)625 (7.0%)4,303 (48.5%)2,429 (27.4%)1,789 (20.2%)806 (9.1%)1,872 (21.1%)
G3a (n = 1,842)1,024 (55.6%)197 (10.7%)272 (14.8%)144 (7.8%)967 (52.5%)472 (25.6%)428 (23.2%)117 (6.4%)380 (20.6%)
G3b (n = 211)152 (72.0%)13 (6.2%)49 (23.2%)30 (14.2%)114 (54.0%)37 (17.5%)79 (37.4%)9 (4.3%)62 (29.4%)
G4 (n = 32)23 (71.9%)3 (9.4%)14 (43.8%)2 (6.3%)18 (56.3%)8 (25%)13 (40.6%)2 (6.3%)15 (46.9%)
G5 (n = 18)16 (88.9%)0 (0%)5 (27.8%)0 (0%)4 (22.2%)2 (11.1%)7 (38.9%)5 (27.8%)3 (16.7%)