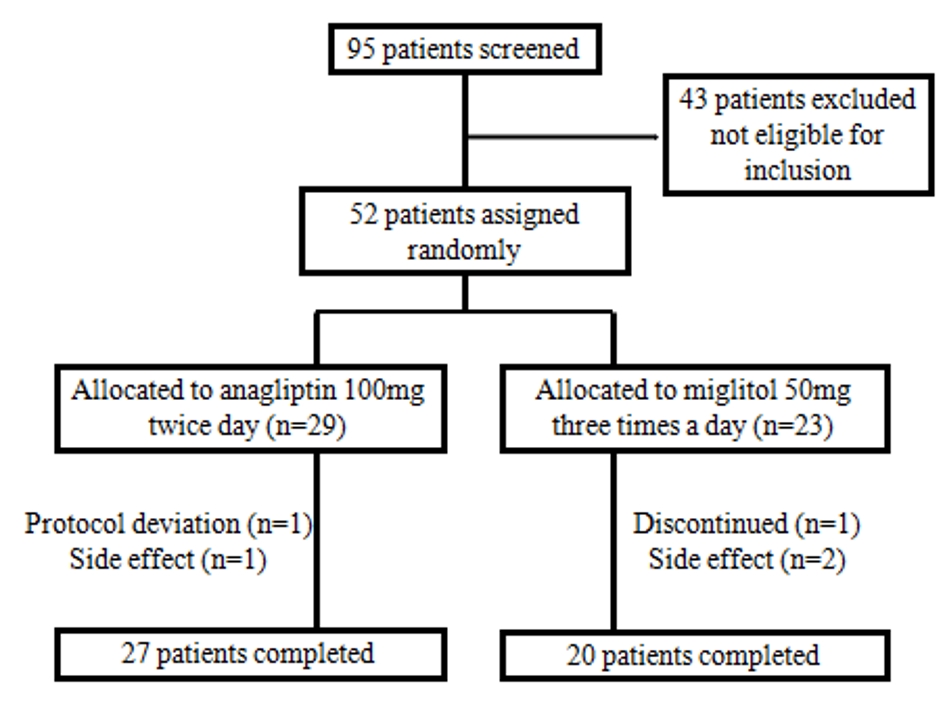
Figure 1. Schematic presentation of this study.
| Journal of Clinical Medicine Research, ISSN 1918-3003 print, 1918-3011 online, Open Access |
| Article copyright, the authors; Journal compilation copyright, J Clin Med Res and Elmer Press Inc |
| Journal website http://www.jocmr.org |
Original Article
Volume 12, Number 2, February 2020, pages 73-78
Comparison of Lipid-Lowering Effects of Anagliptin and Miglitol in Patients With Type 2 Diabetes: A Randomized Trial
Figures
Tables
| Anagliptin group (n = 29) | Miglitol group (n = 23) | P | |
|---|---|---|---|
| Sex ratio/distribution (men/women) | 23/6 | 19/4 | 1.0000 |
| Age (years) | 53.7 ± 8.5 | 56.3 ± 8.4 | 0.2865 |
| Duration of diabetes (years) | 6.5 ± 7.9 | 3.6 ± 3.2 | 0.0789 |
| Body weight (kg) | 77.0 ± 17.1 | 75.6 ± 13.7 | |
| Height (cm) | 165.6 ± 7.0 | 167.8 ± 8.1 | |
| Body mass index (kg/m2) | 27.9 ± 4.6 | 26.8 ± 4.3 |
| Anagliptin group (n = 29) | Miglitol group (n = 23) | P3 | |||||||
|---|---|---|---|---|---|---|---|---|---|
| Baseline | 4 weeks | 12 weeks | P1 | Baseline | 4 weeks | 12 weeks | P2 | ||
| P1: comparison of changes between baseline and after 12 weeks in anagliptin group; P2: comparison of changes between baseline and after 12 weeks in miglitol group; and P3: comparison of each level between anagliptin group and miglitol group at 12 weeks. HbA1c: hemoglobin A1c; LDL-C: low-density lipoprotein cholesterol; HDL-C: high-density lipoprotein cholesterol; TC: total cholesterol; TG: triglyceride; apoB-48: apolipoprotein B-48; apoB-100: apolipoprotein B-100; MDA-LDL-C: malondialdehyde-modified LDL-C; sd-LDL-C: small dense LDL-C. | |||||||||
| Number | 29 | 27 | 23 | 20 | |||||
| HbA1c (%) | 7.9 ± 1.2 | 7.6 ± 1.3 | 7.2 ± 1.3 | 0.0000 | 8.0 ± 1.8 | 7.4 ± 1.3 | 7.3 ± 1.1 | 0.0068 | 0.0773 |
| LDL-C (mg/dL) | 153.8 ± 30.7 | 149.7 ± 24.5 | 147.6 ± 23.1 | 0.1897 | 148.1 ± 22.8 | 140.7 ± 19.6 | 150.3 ± 20.3 | 0.2114 | 0.1717 |
| HDL-C (mg/dL) | 53.4 ± 15.7 | 52.4 ± 16.0 | 51.8 ± 15.7 | 0.0216 | 59.0 ± 11.4 | 55.5 ± 12.7 | 55.9 ± 13.5 | 0.1821 | 0.7419 |
| Non HDL-C (mg/dL) | 176.8 ± 35.4 | 171.1 ± 27.2 | 169.6 ± 25.1 | 0.0165 | 170.0 ± 25.5 | 159.2 ± 20.5 | 170.5 ± 22.2 | 0.5668 | 0.2869 |
| TC (mg/dL) | 230.2 ± 40.0 | 223.6 ± 30.1 | 221.4 ± 31.2 | 0.0929 | 229.0 ± 29.3 | 214.8 ± 26.4 | 226.4 ± 28.1 | 0.9349 | 0.1899 |
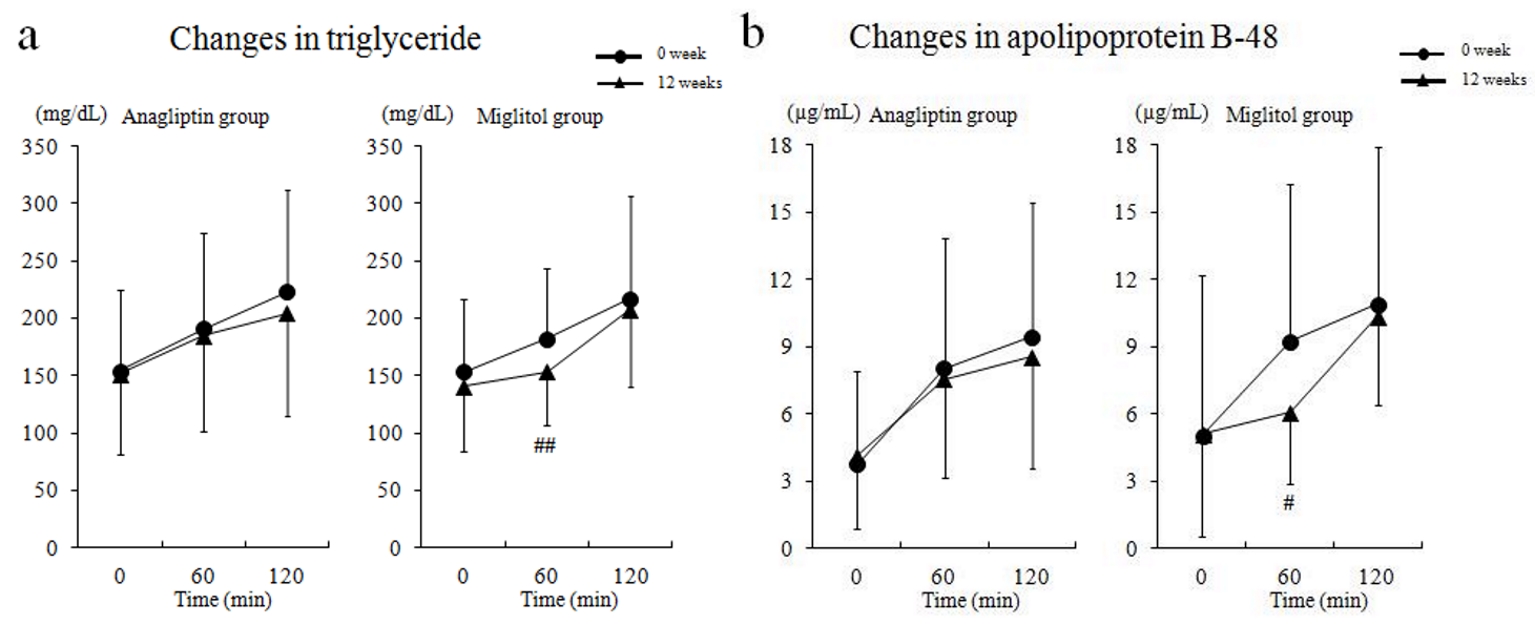
| TG (mg/dL) | 154.2 ± 92.4 | 146.4 ± 78.5 | 152.0 ± 72.1 | 0.8439 | 153.6 ± 63.0 | 140.7 ± 46.4 | 145.0 ± 59.9 | 0.3754 | 0.4892 |
| ApoB-48 (µg/mL) | 3.8 ± 4.1 | - | 4.2 ± 3.4 | 0.3900 | 5.0 ± 7.1 | - | 5.1 ± 4.5 | 0.9585 | 0.7369 |
| ApoB-100 (µg/mL) | 4.3 ± 1.1 | - | 4.3 ± 1.1 | 0.6403 | 4.4 ± 1.0 | - | 4.2 ± 0.9 | 0.2579 | 0.5828 |
| Sd-LDL-C (mg/dL) | 56.6 ± 21.9 | - | 49.2 ± 14.8 | 0.0510 | 55.6 ± 18.0 | - | 53.5 ± 18.7 | 0.4529 | 0.2632 |
| MDA-LDL-C (U/L) | 164.1 ± 38.6 | - | 152.3 ± 34.7 | 0.1046 | 166.2 ± 41.2 | - | 173.3 ± 82.3 | 0.5829 | 0.1075 |
| Lathosterol (µg/mL) | 3.2 ± 1.3 | - | 3.1 ± 1.2 | 0.7182 | 3.4 ± 1.2 | - | 3.1 ± 1.3 | 0.0599 | 0.4334 |
| Campesterol (µg/mL) | 4.1 ± 1.7 | - | 4.5 ± 1.9 | 0.2177 | 4.1 ± 2.1 | - | 4.4 ± 2.6 | 0.0407 | 0.4254 |
| Sitosterol (µg/mL) | 2.2 ± 0.9 | - | 2.4 ± 1.0 | 0.1365 | 2.1 ± 1.0 | - | 2.4 ± 1.3 | 0.0441 | 0.3156 |
| Cholestanol (µg/mL) | 2.5 ± 0.8 | - | 2.5 ± 0.8 | 0.6713 | 2.4 ± 0.5 | - | 2.5 ± 0.6 | 0.1513 | 0.7512 |
| Adverse effects | Anagliptin group | Miglitol group |
|---|---|---|
| Values are n. | ||
| Gastrointestinal symptoms | 3 | 15 |
| Drug eruption | 1 | |
| Liver dysfunction | 1 | |
| Weight loss | 2 | |
| Medication adherence | Anagliptin group | Miglitol group | P |
|---|---|---|---|
| Percentage forgetting to take oral medication | 1.58 ± 3.46 | 3.36 ± 4.59 | 0.1184 |