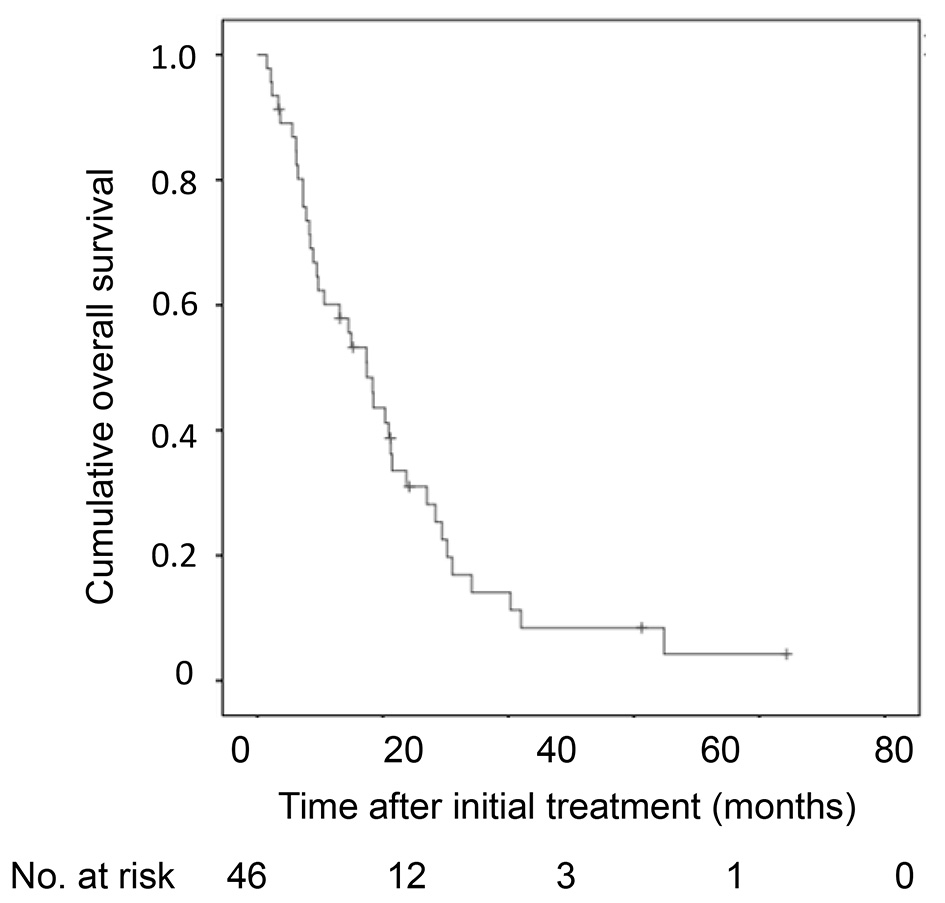
Figure 1. Kaplan-Meier analysis of cumulative OS of the 46 HCC patients with 30 nodules or more. OS: overall survival; HCC: hepatocellular carcinoma.
| Journal of Clinical Medicine Research, ISSN 1918-3003 print, 1918-3011 online, Open Access |
| Article copyright, the authors; Journal compilation copyright, J Clin Med Res and Elmer Press Inc |
| Journal website http://www.jocmr.org |
Original Article
Volume 12, Number 1, January 2020, pages 26-35
Prognostic Factors for Patients With a Large Number of Hepatocellular Carcinoma Nodules
Figures
Tables
| Content of therapy | No. (%) |
|---|---|
| HCC: hepatocellular carcinoma; TACE: transarterial chemoembolization; TAI: transarterial infusion chemotherapy; RFA: radiofrequency ablation; PEI: percutaneous ethanol injection. | |
| Previous treatment | |
| Any | 43 (93%) |
| TACE | 38 (83%) |
| TAI | 3 (7%) |
| RFA | 22 (48%) |
| PEI | 13 (28%) |
| Hepatic resection | 14 (30%) |
| Initial treatment | |
| Any | 46 (100%) |
| TACE | 39 (85%) |
| TAI | 7 (15%) |
| Sorafenib | 1 (2%) |
| After treatment | |
| Any | 35 (76%) |
| TACE | 26 (57%) |
| TAI | 17 (37%) |
| Sorafenib | 11 (24%) |
| Clinical characteristics | Univariate analysis | Multivariate analysis | ||||
|---|---|---|---|---|---|---|
| HR | 95% CI | P value | HR | 95% CI | P value | |
| Significant factors (P < 0.05) in univariate analysis (gender, total bilirubin, albumin, prothrombin time, number of tumor and initial therapy) and age were used in the multivariate analysis. HCC: hepatocellular carcinoma; HR: hazards ratio; CI: confidence interval; ALT: alanine aminotransferase; AFP: alpha-fetoprotein; DCP: des-gamma-carboxy prothrombin; TACE: transarterial chemoembolization. | ||||||
| Age (/1 year increment) | 0.991 | 0.949 - 1.034 | 0.679 | 1.015 | 0.966 - 1.066 | 0.558 |
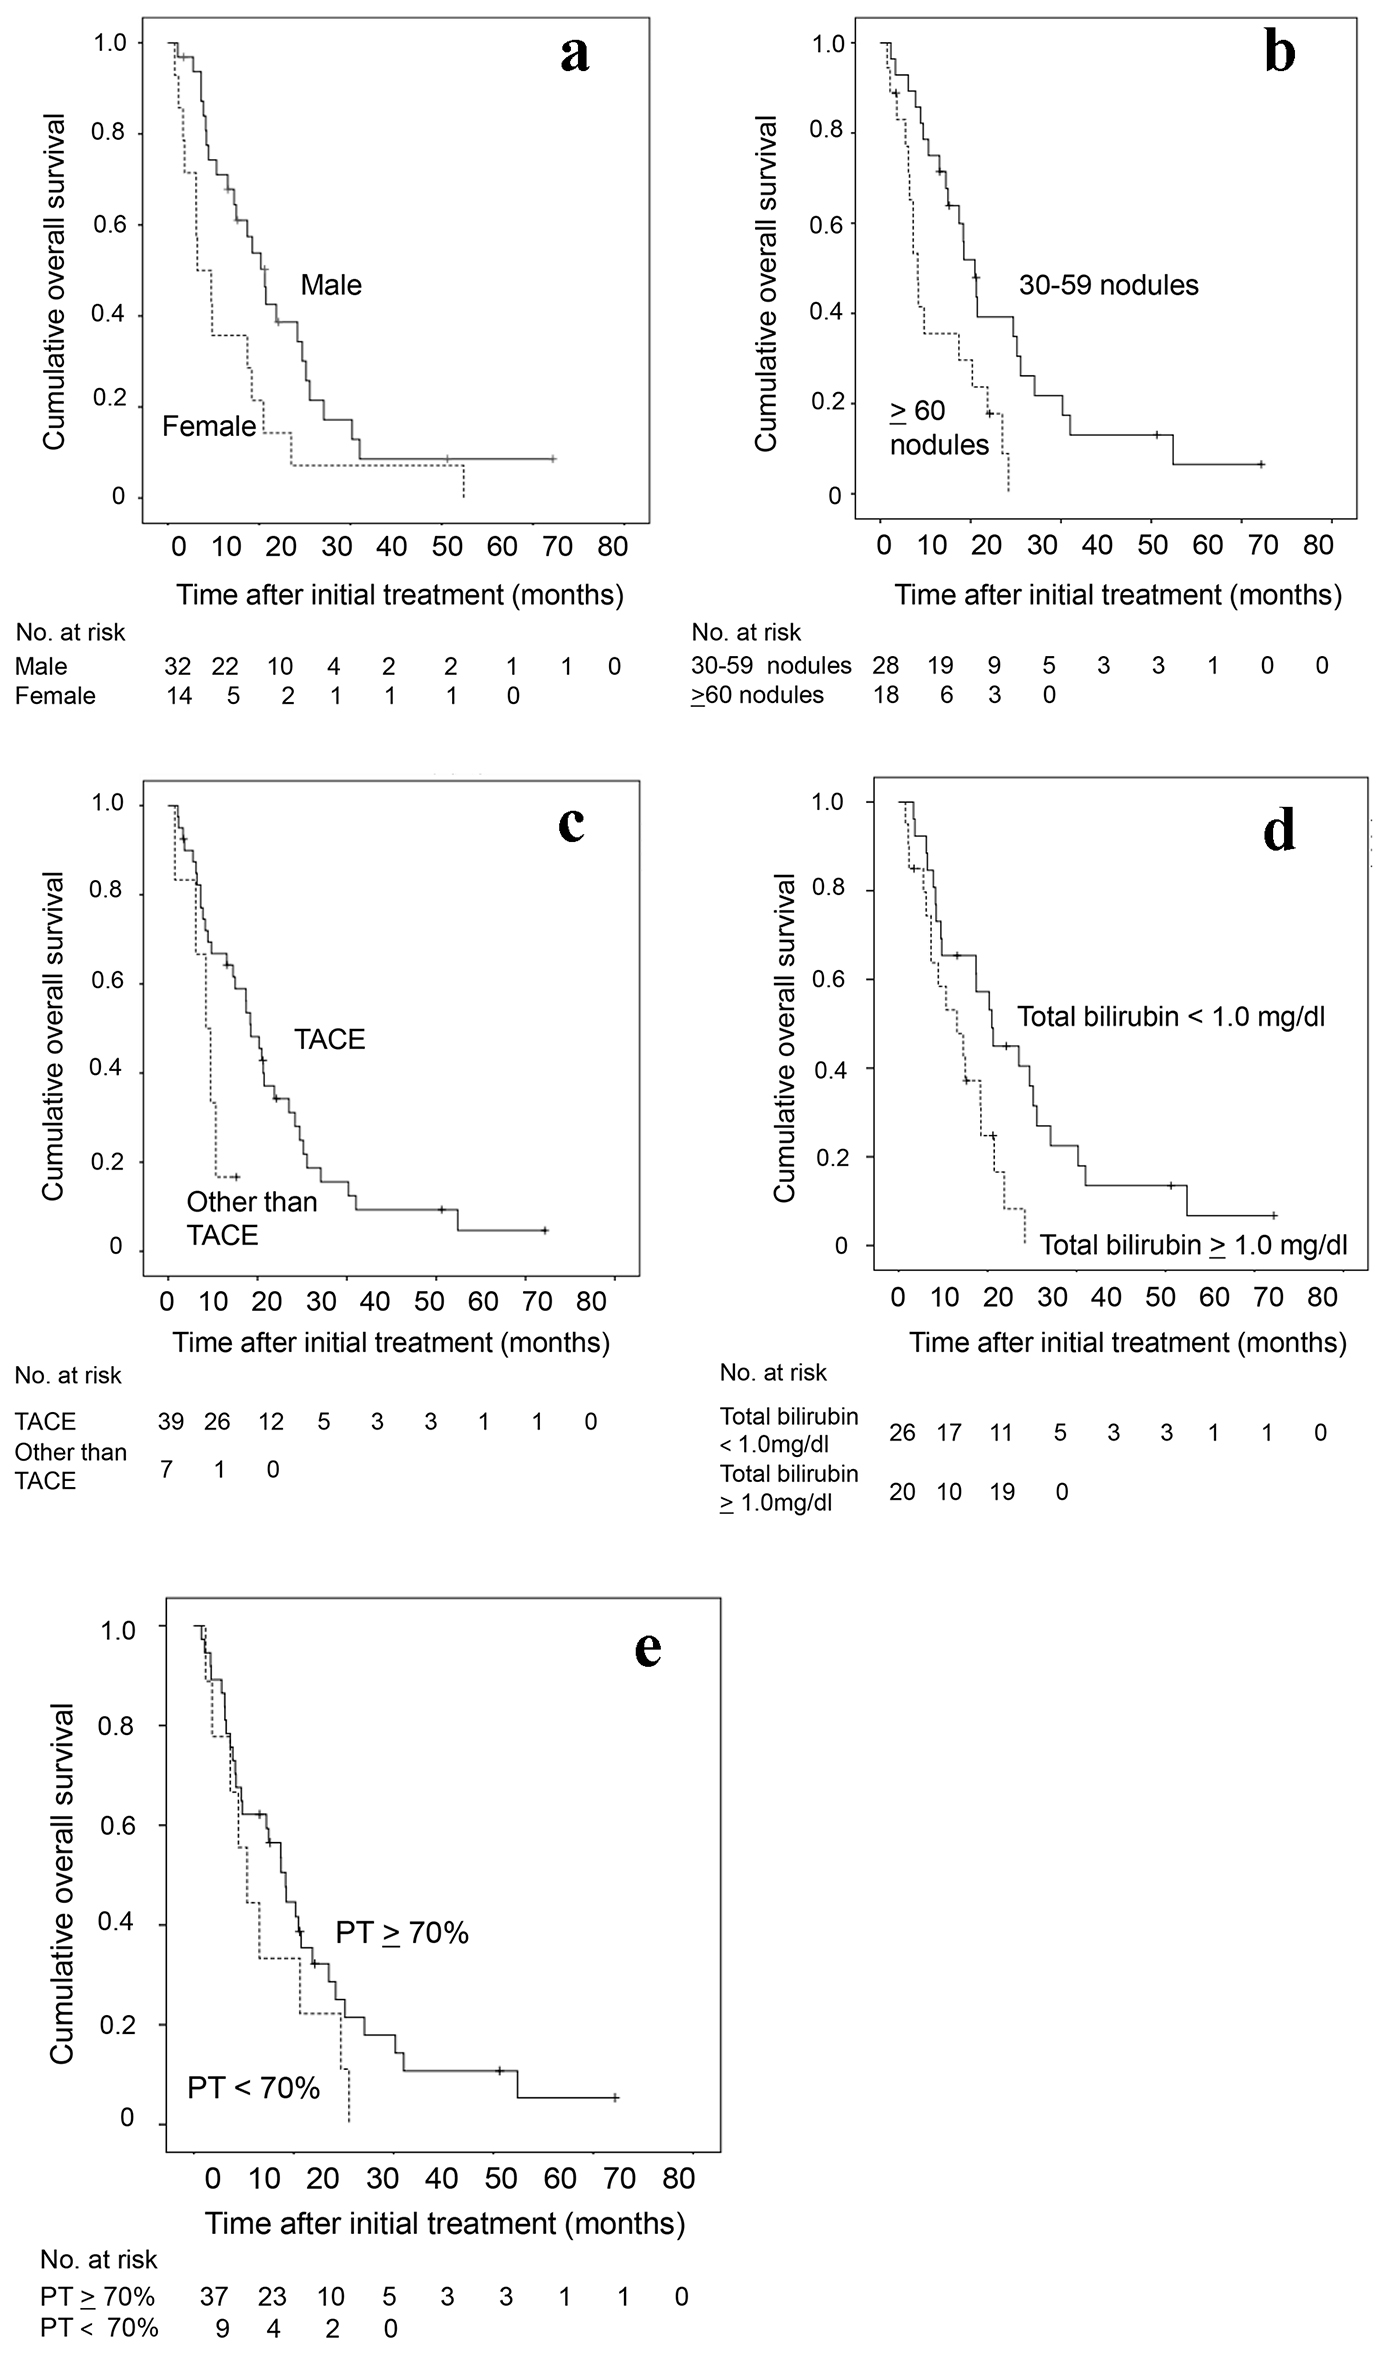
| Gender (male) | 0.467 | 0.240 - 0.908 | 0.025 | 0.283 | 0.130 - 0.617 | 0.002 |
| Hepatitis C | 0.549 | 0.248 - 1.215 | 0.139 | |||
| Hepatitis B | 1.291 | 0.488 - 3.419 | 0.607 | |||
| Alcohol (< 60 mg/day) | 1.505 | 0.532 - 4.256 | 0.441 | |||
| Child-Pugh classification (A) | 0.561 | 0.274 - 1.149 | 0.114 | |||
| ALT (/1 U/L increment) | 0.992 | 0.976 - 1.009 | 0.351 | |||
| Total bilirubin (/1 mg/dL increment) | 2.714 | 1.185 - 6.217 | 0.018 | 4.178 | 1.394 - 12.518 | 0.011 |
| Albumin (/1 g/dL increment) | 0.304 | 0.144 - 0.642 | 0.002 | 0.877 | 0.307 - 2.502 | 0.806 |
| Prothrombin time (/1% increment) | 0.965 | 0.940 - 0.991 | 0.009 | 0.959 | 0.920 - 1.000 | 0.049 |
| AFP (< 100 ng/mL) | 0.705 | 0.368 - 1.350 | 0.292 | |||
| DCP (< 200 mAU/mL) | 0.772 | 0.401 - 1.488 | 0.440 | |||
| Maximum diameter of tumor (< 30 mm) | 0.738 | 0.381 - 1.429 | 0.367 | |||
| Number of tumor (30 - 59 nodules) | 0.378 | 0.187 - 0.763 | 0.007 | 0.284 | 0.130 - 0.613 | 0.002 |
| Initial therapy (TACE) | 0.291 | 0.071 - 0.762 | 0.012 | 0.301 | 0.104 - 0.890 | 0.027 |
| Patient subgroup | Median survival time (months) (95% CI) | P valuea | |
|---|---|---|---|
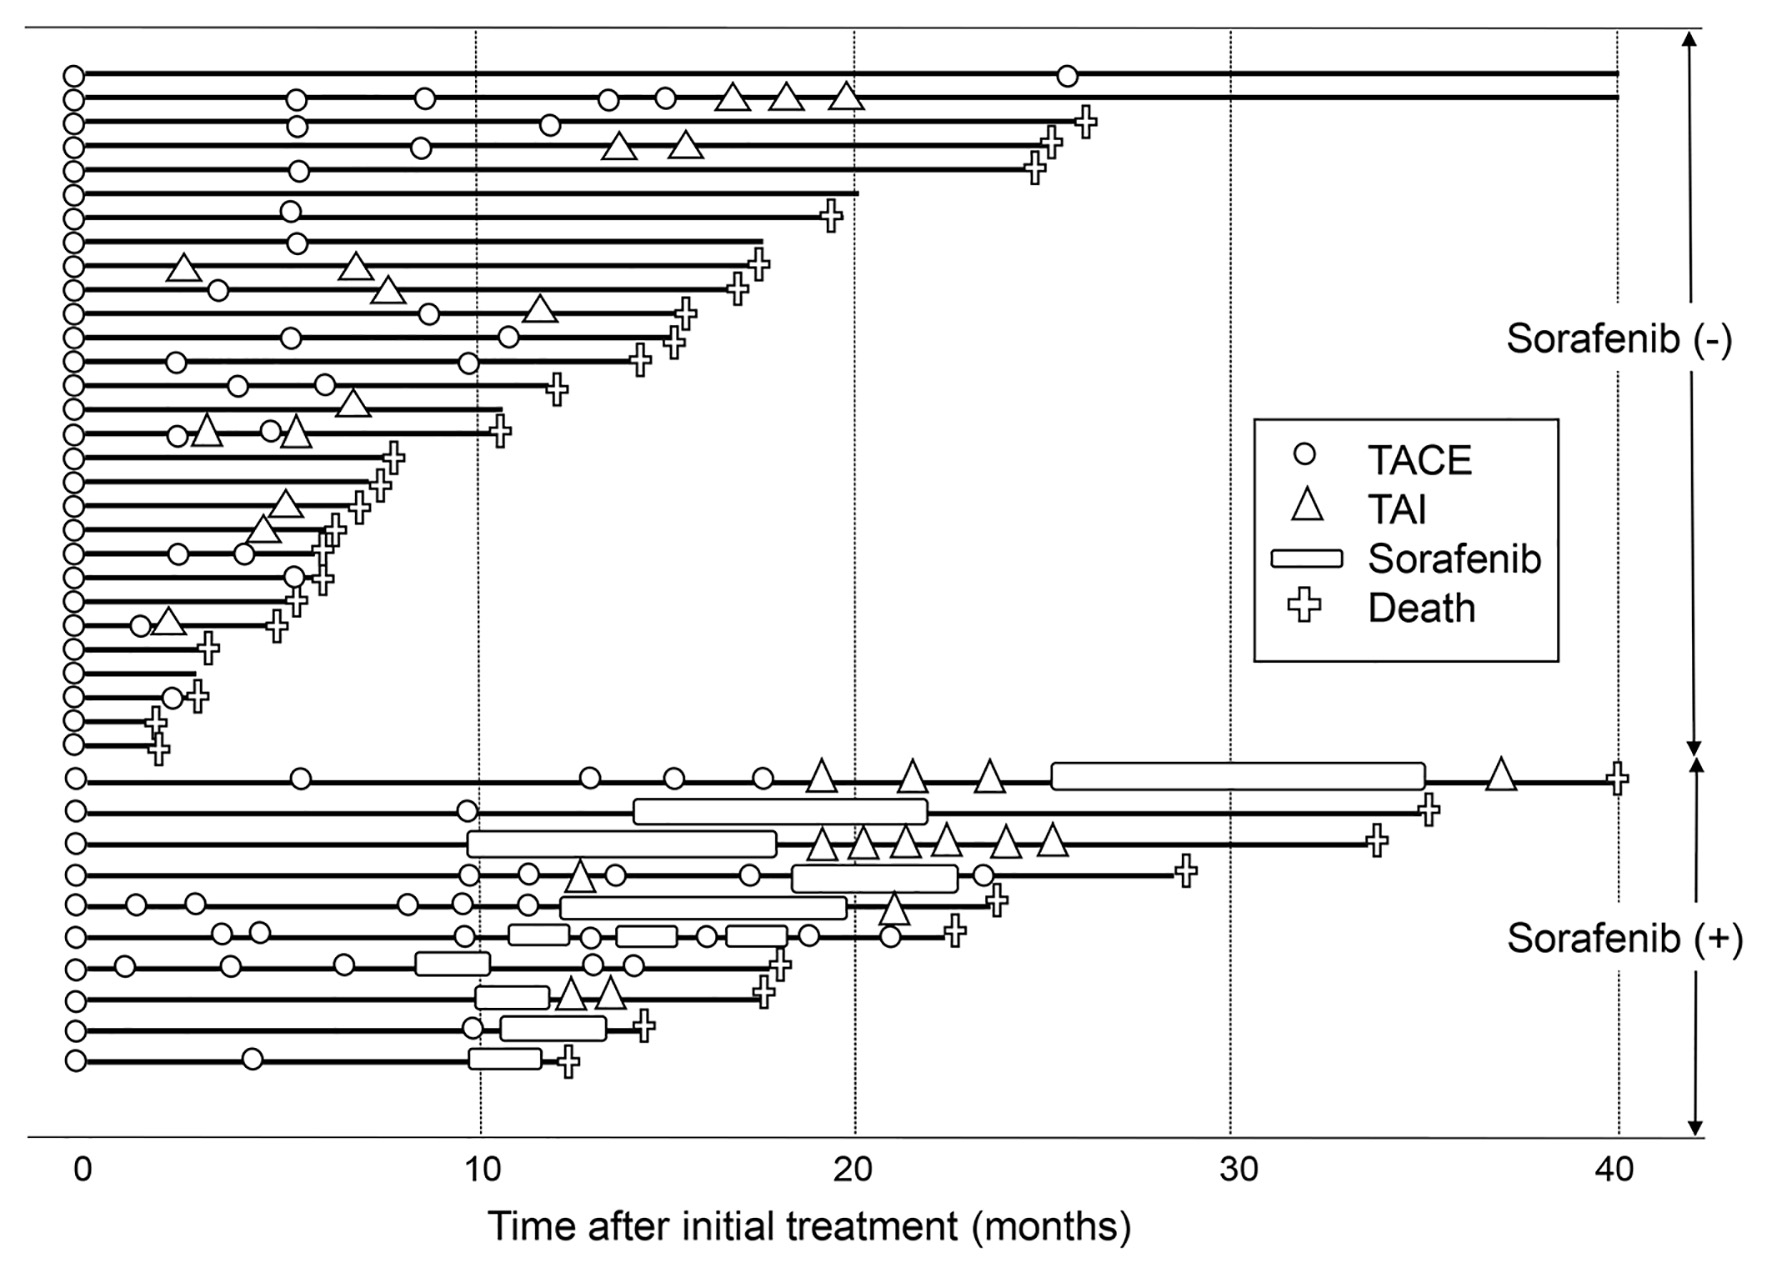
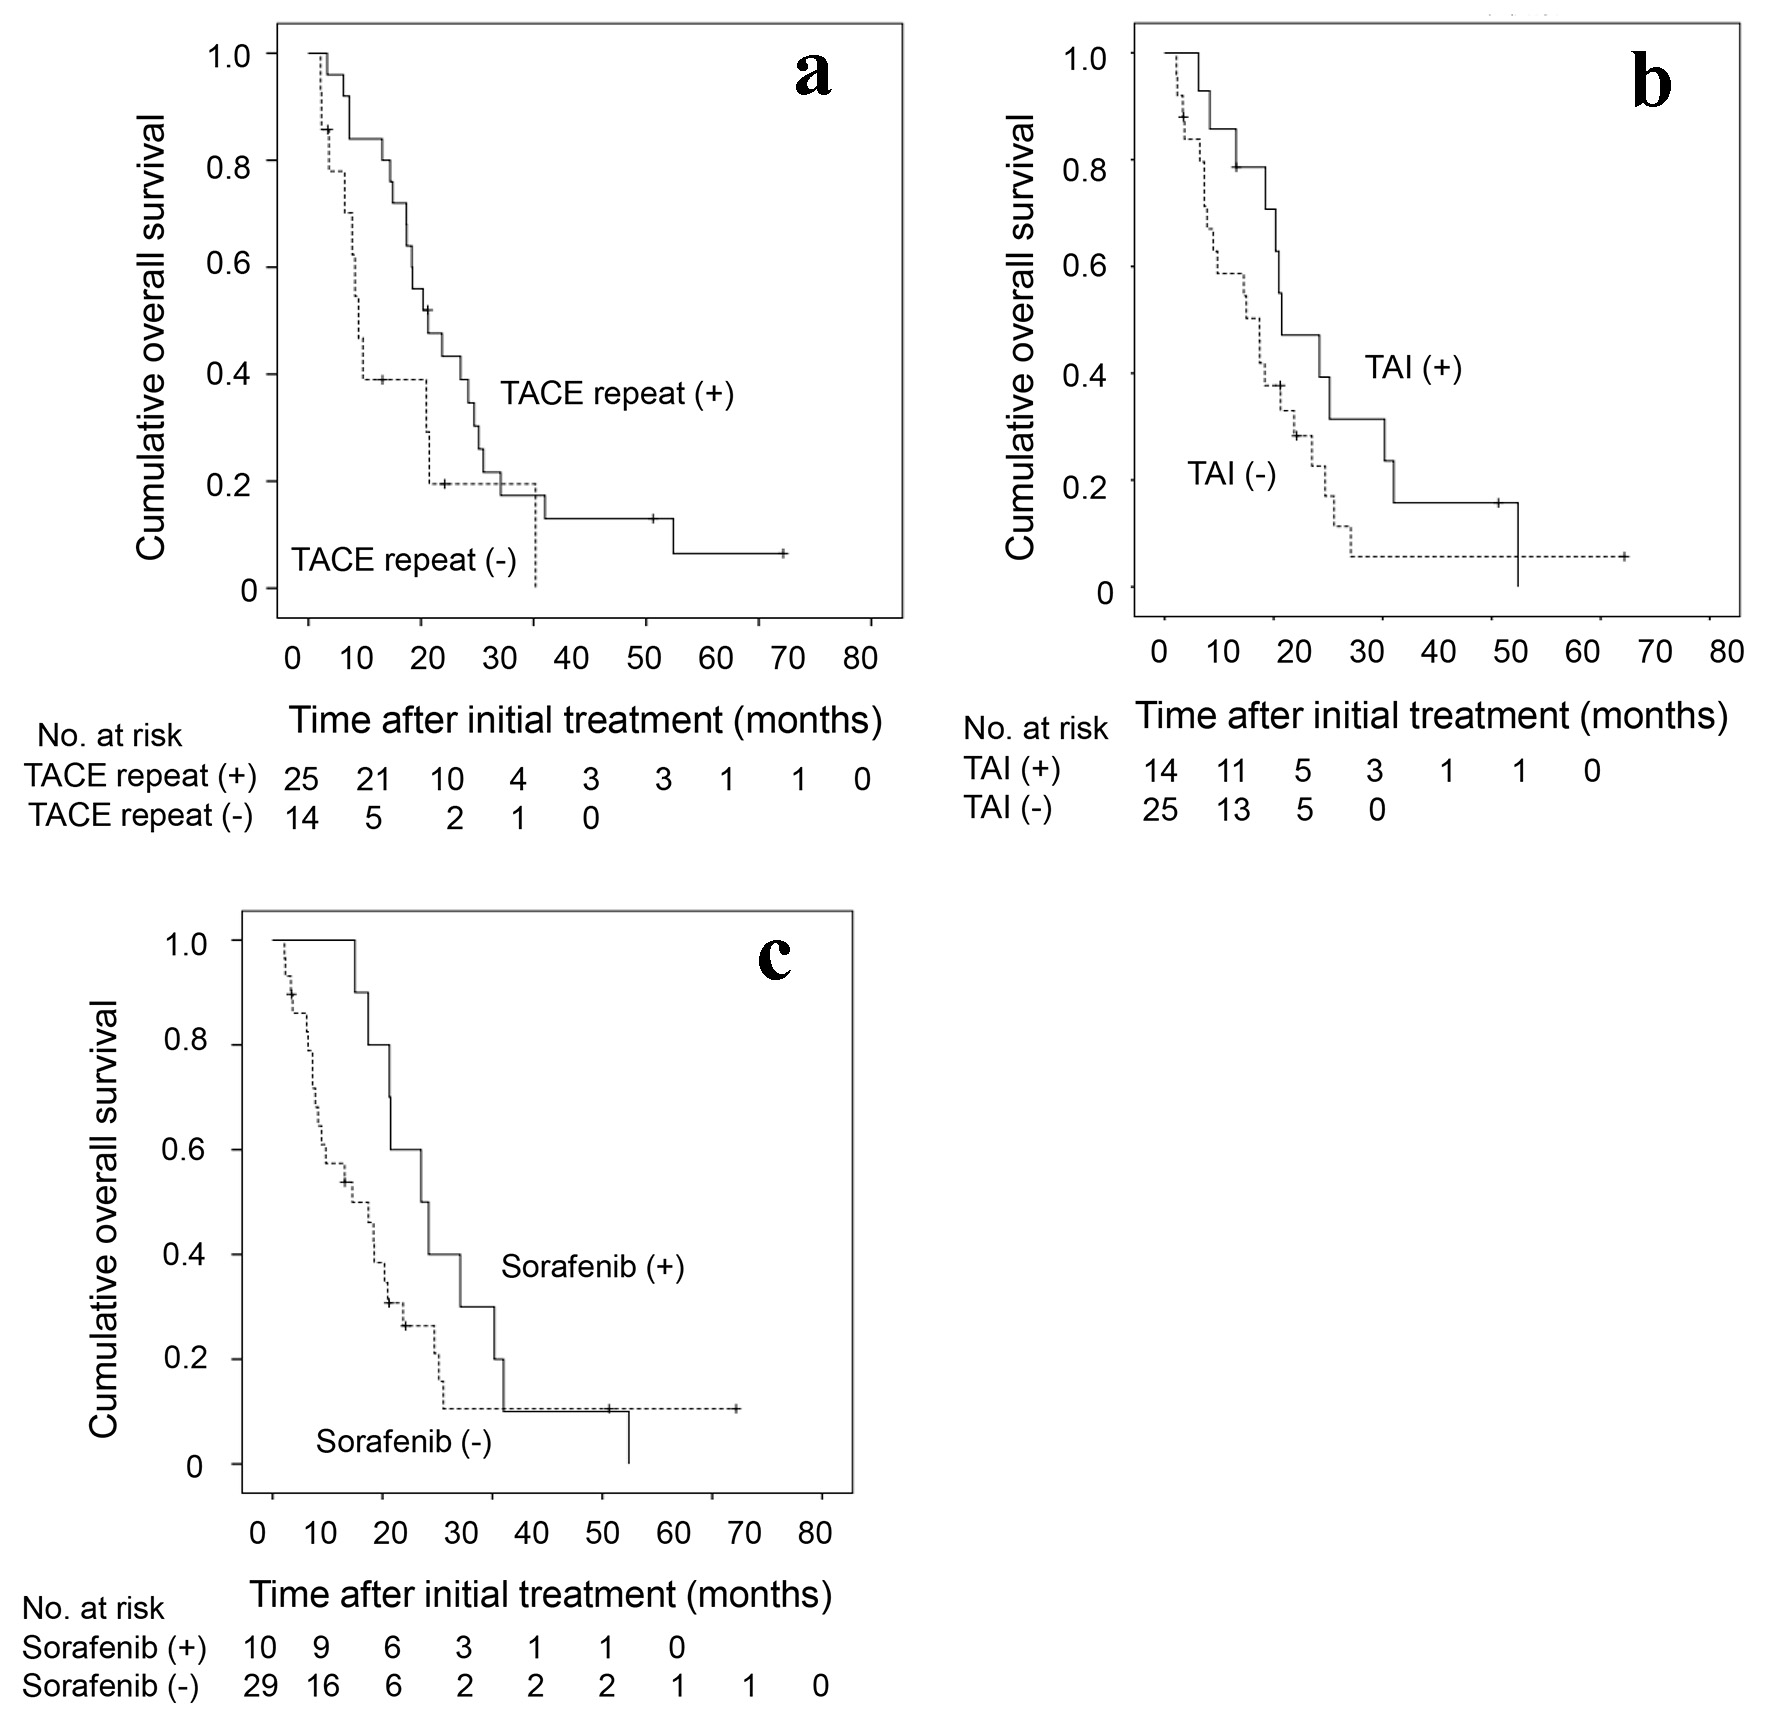
| Patients with subsequent sorafenib administration (n = 29) | Patients without subsequent sorafenib administration (n = 10) | ||
| aP values in the difference of the cumulative overall survival between patients with and without subsequent sorafenib administration were determined by the generalized Wilcoxon test. HCC: hepatocellular carcinoma; TACE: transarterial chemoembolization; CI: confidence interval; TAI: transarterial infusion chemotherapy. | |||
| All (n = 39) | 22.5 (13.6 - 31.5) | 12.1 (3.19 - 21.0) | 0.026 |
| Survival of > 6 months (n = 32) | 22.5 (13.6 - 31.5) | 15.4 (11.9 - 19.0) | 0.100 |
| Subsequent TACE or TAI at least once (n = 30) | 22.5 (13.6 - 31.5) | 15.4 (12.1 - 18.8) | 0.098 |
| Survival of > 6 months and subsequent TACE or TAI > 2 or more (n = 18) | 23.7 (20.8 - 26.6) | 15.4 (12.8 - 18.1) | 0.033 |