Journal of Clinical Medicine Research, ISSN 1918-3003 print, 1918-3011 online, Open Access
Article copyright, the authors; Journal compilation copyright, J Clin Med Res and Elmer Press Inc
Journal website http://www.jocmr.org

Original Article

Volume 11, Number 12, December 2019, pages 818-824


Associations of ABC (Hemoglobin A1c, Blood Pressure and Low-Density Lipoprotein Cholesterol) Goal Achievement With Chronic Kidney Disease in Type 2 Diabetic Patients With Preserved Kidney Function

Figures

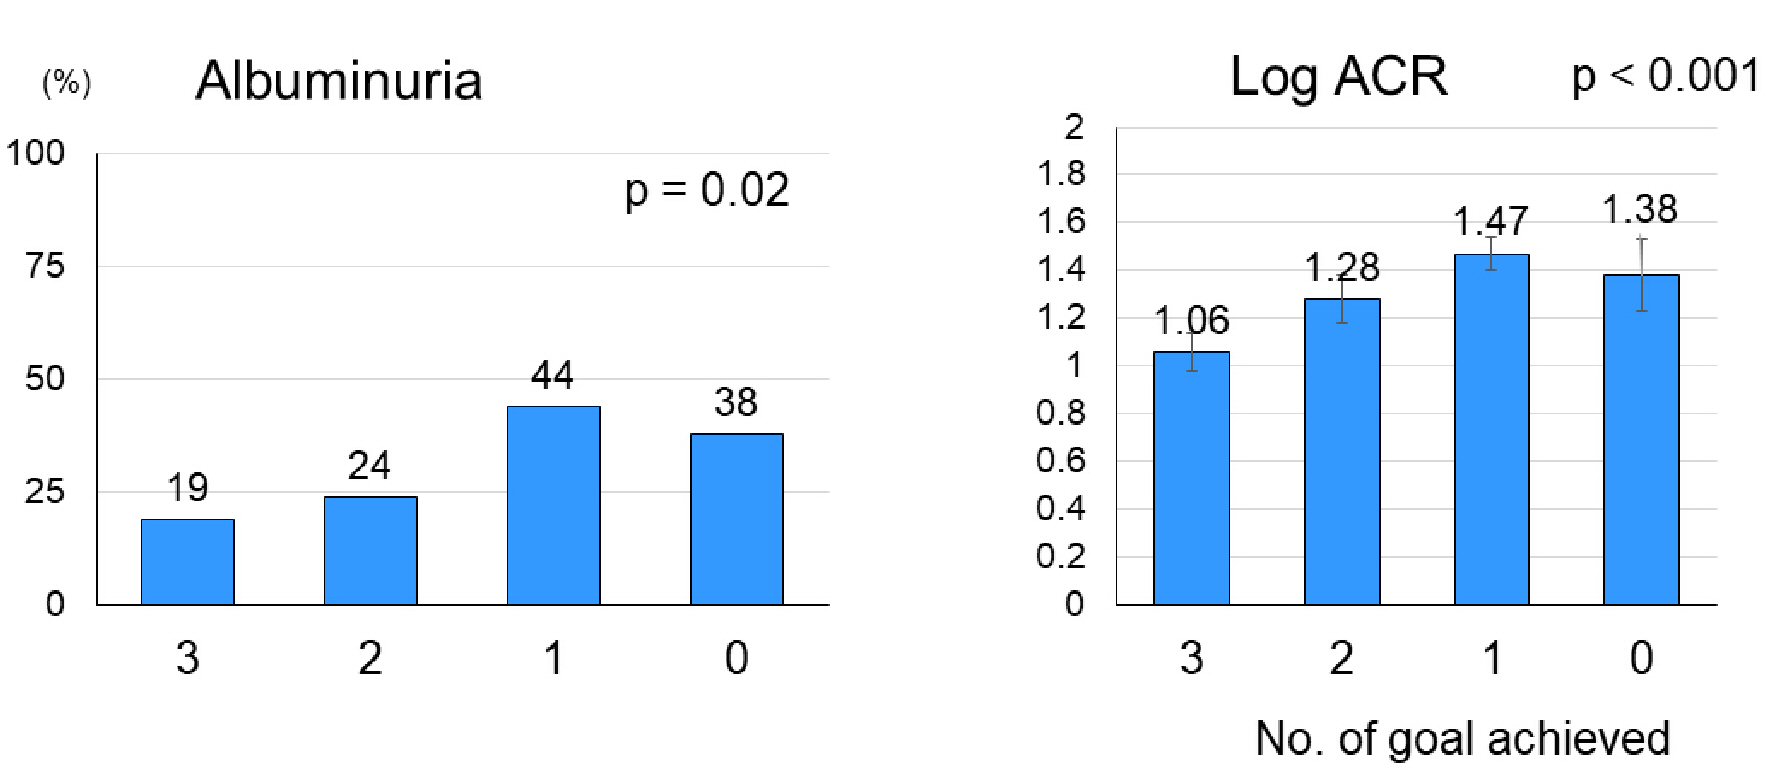
Figure 1.
Figure 1. Mean (± SE) log urinary ACR and the percentage of patients with albuminuria (ACR ≥ 30 mg/g) at baseline according to the number of ABC (HbA1c, blood pressure and LDL-C) goal achievement. Among 168 patients with type 2 diabetes, 47, 45, 63 and 13 patients achieved triple-goal, dual-goal, single-goal and no-goal, respectively, at baseline. SE: standard error; ACR: albumin-to-creatinine ratio; HbA1c: hemoglobin A1c; LDL-C: low-density lipoprotein cholesterol.
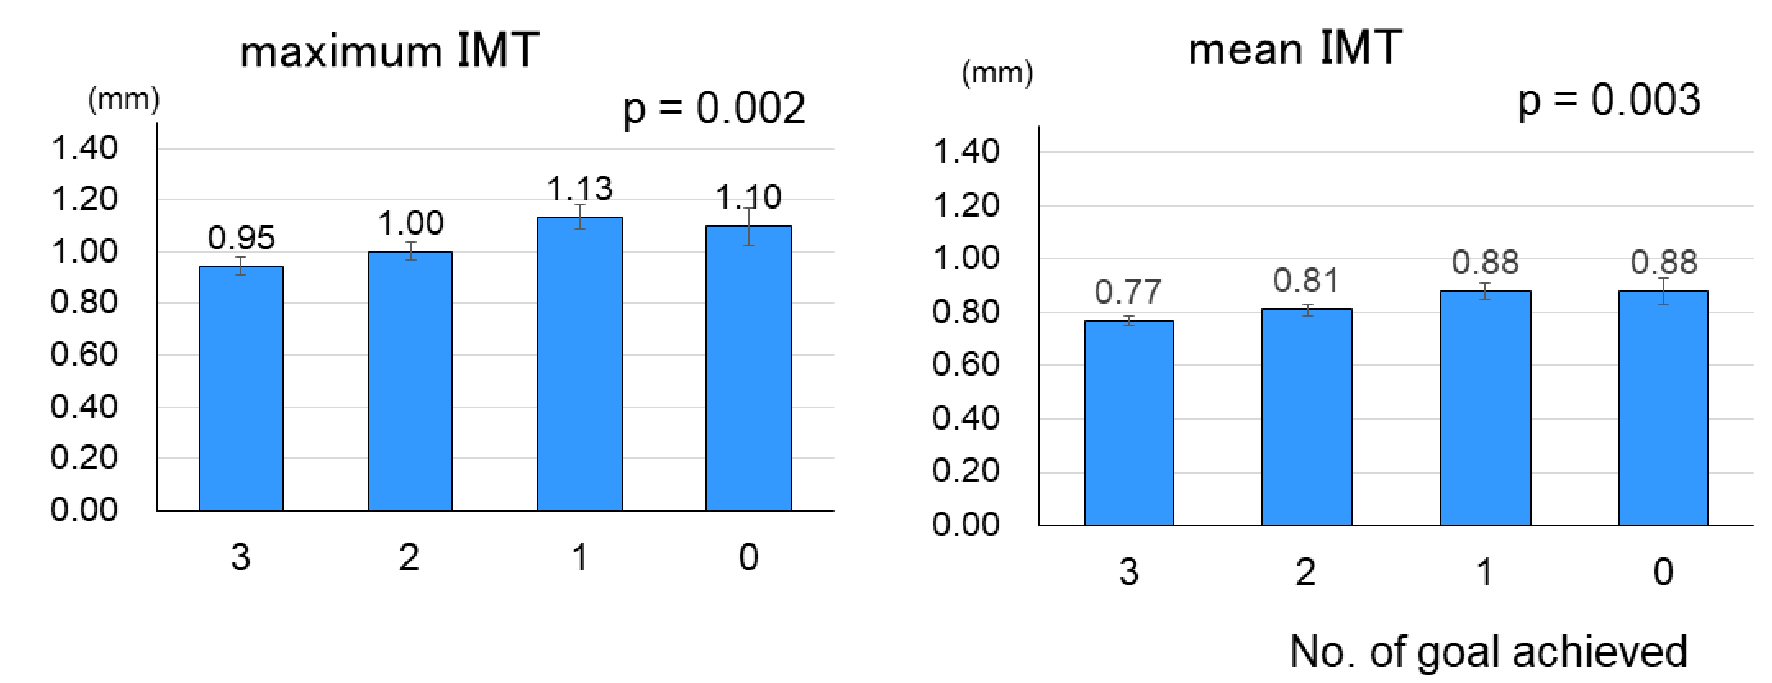
Figure 2.
Figure 2. Maximum and mean carotid IMT at baseline according to the number of ABC (HbA1c, blood pressure and LDL-C) goal achievement (mean ± SE). See Figure 1 for the number of patients in each goal achievers. IMT: intima-media thickness; HbA1c: hemoglobin A1c; LDL-C: low-density lipoprotein cholesterol; SE: standard error.
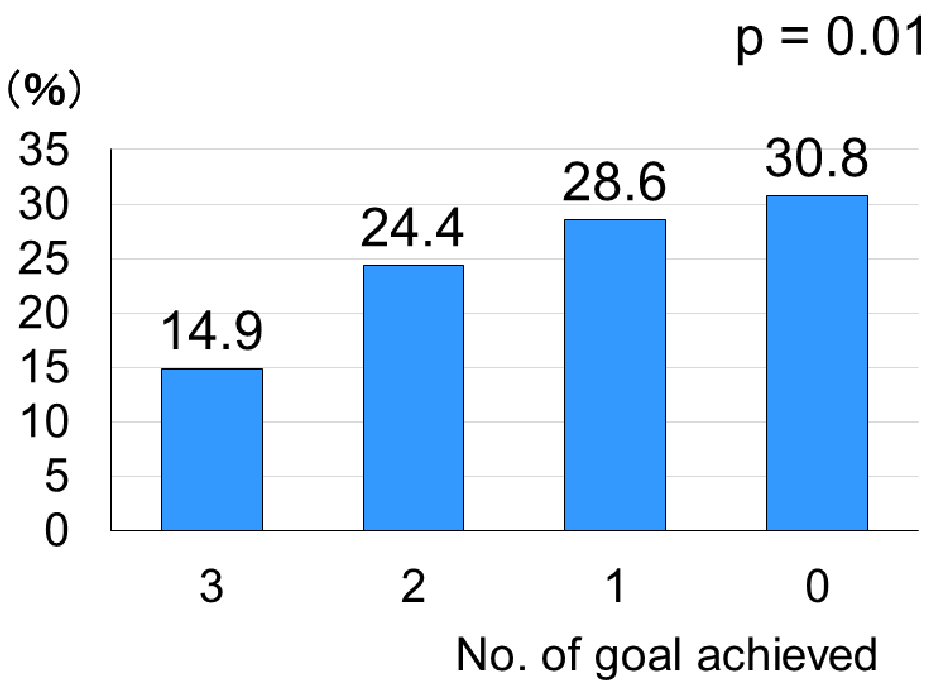
Figure 3.
Figure 3. The percentage of deterioration of glomerular filtration rate stages over a median follow-up of 6.0 years according to the number of ABC (HbA1c, blood pressure and LDL-C) goal achievement at baseline. See Figure 1 for the number of patients in each goal achievers. HbA1c: hemoglobin A1c; LDL-C: low-density lipoprotein cholesterol.
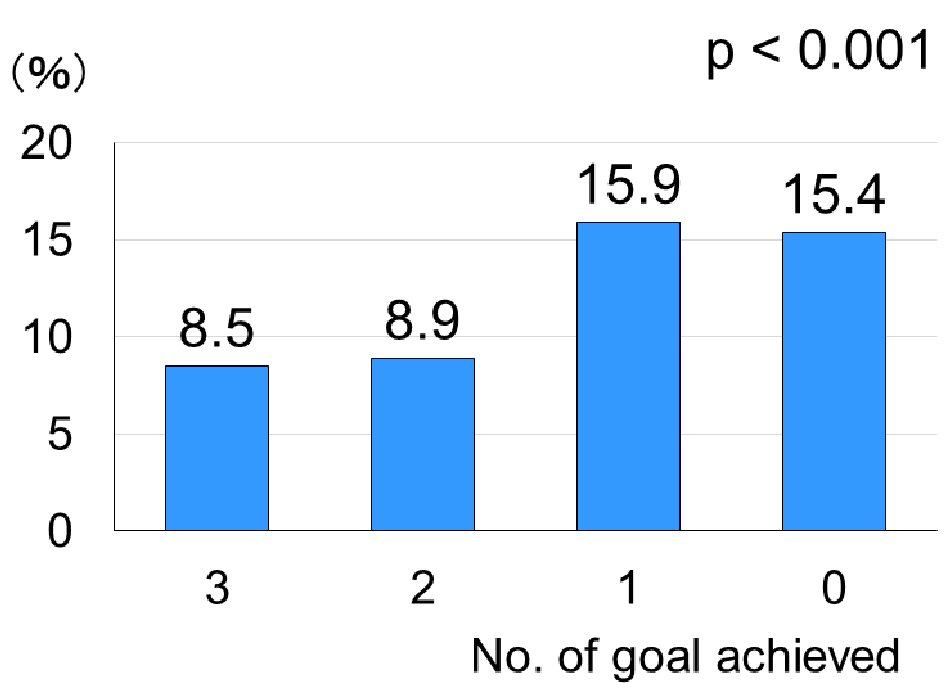
Figure 4.
Figure 4. The percentage of deterioration of albuminuric stages over a median follow-up of 6.0 years according to the number of ABC (HbA1c, blood pressure and LDL-C) goal achievement at baseline. See Figure 1 for the number of patients in each goal achievers. HbA1c: hemoglobin A1c; LDL-C: low-density lipoprotein cholesterol.

Tables

Table 1. Anthropometric and Clinical Characteristics of Patients at Baseline According to the Number of Goal Achievement
 
Triple-goal achievers (n = 47)Dual-goal achievers (n = 45)Single-goal achievers (n = 63)No-goal achievers (n = 13)P values
Mean ± SE or n (%). SE: standard error; OHA: oral anti-diabetes drugs; RASi: renin-angiotensin-aldosterone system inhibitors; BMI: body mass index.
Male sex, n (%)20 (42.6%)30 (66.7%)35 (55.6%)5 (38.5%)0.08
Smokers, n (%)12 (25.5%)18 (40.0%)24 (38.1%)4 (30.8%)0.29
Age (years)62.1 ± 1.562.6 ± 1.362.1 ± 1.463.8 ± 2.90.95
BMI (kg/m2)23.8 ± 0.523.9 ± 0.624.6 ± 0.525.0 ± 0.50.53
Waist circumference (cm)85.9 ± 1.485.0 ± 1.288.7 ± 1.588.4 ± 1.50.22
Diabetes duration (years)7.4 ± 0.712.2 ± 1.29.6 ± 0.912.1 ± 2.30.01
Diabetes therapy, n (%)
  Diet/exercise19 (40.4%)15 (33.3%)18 (29%)1 (7.7%)0.26
  OHA24 (51.1%)22 (48.9%)32 (50.8%)7 (53.8%)0.99
  Insulin4 (8.5%)8 (17.8%)13 (20.6%)5 (38.5%)< 0.001
  Users of RASi17 (36.2%)17 (37.8%)27 (42.9%)9 (69.2%)0.17


Table 2. Glycemic, Lipids and Blood Pressure Control and Kidney Function of Patients at Baseline According to the Number of Goal Achievement
 
Triple-goal achieversDual-goal achieversSingle-goal achieversNo-goal achieversP values
Mean ± SE or n (%). SE: standard error; PG: plasma glucose; LDL-C: low-density lipoprotein cholesterol; TG: triglyceride: BP: blood pressure; eGFR: estimated glomerular filtration rate; ΔeGFR: annual changes in eGFR.
Fasting PG (mg/dL)112 ± 2125 ± 3132 ± 3141 ± 5< 0.001
HbA1c (%)6.4 ± 0.17 ± 0.17.4 ± 0.17.6 ± 0.1< 0.001
Cholesterol (mg/dL)179 ± 3187 ± 3194 ± 3198 ± 4< 0.001
HDL cholesterol (mg/dL)59 ± 259 ± 352 ± 248 ± 30.013
LDLC cholesterol (mg/dL)100 ± 2107 ± 3119 ± 3128 ± 5< 0.001
Fasting TG (mg/dL)105 ± 7109 ± 7123 ± 7128 ± 130.19
Uric acid (mg/dL)5.1 ± 0.25.5 ± 0.25.1 ± 0.24.6 ± 0.20.19
Systolic BP (mm Hg)121 ± 1127 ± 2133 ± 1139 ± 3< 0.001
Diastolic BP (mm Hg)70 ± 172 ± 174 ± 175 ± 20.005
Creatinine0.72 ± 0.020.82 ± 0.040.73 ± 0.020.72 ± 0.040.06
eGFR (mL/min/1.73 m2)75 ± 274 ± 378 ± 276 ± 50.69
ΔeGFR (mL/min/1.73 m2/year)-0.70 ± 0.46-1.13 ± 0.45-1.18 ± 0.40-2.10 ± 0.900.54
Reduced GFR (n (%))7 (14.9%)9 (20.0%)8 (12.7%)2 (15.4%)0.78