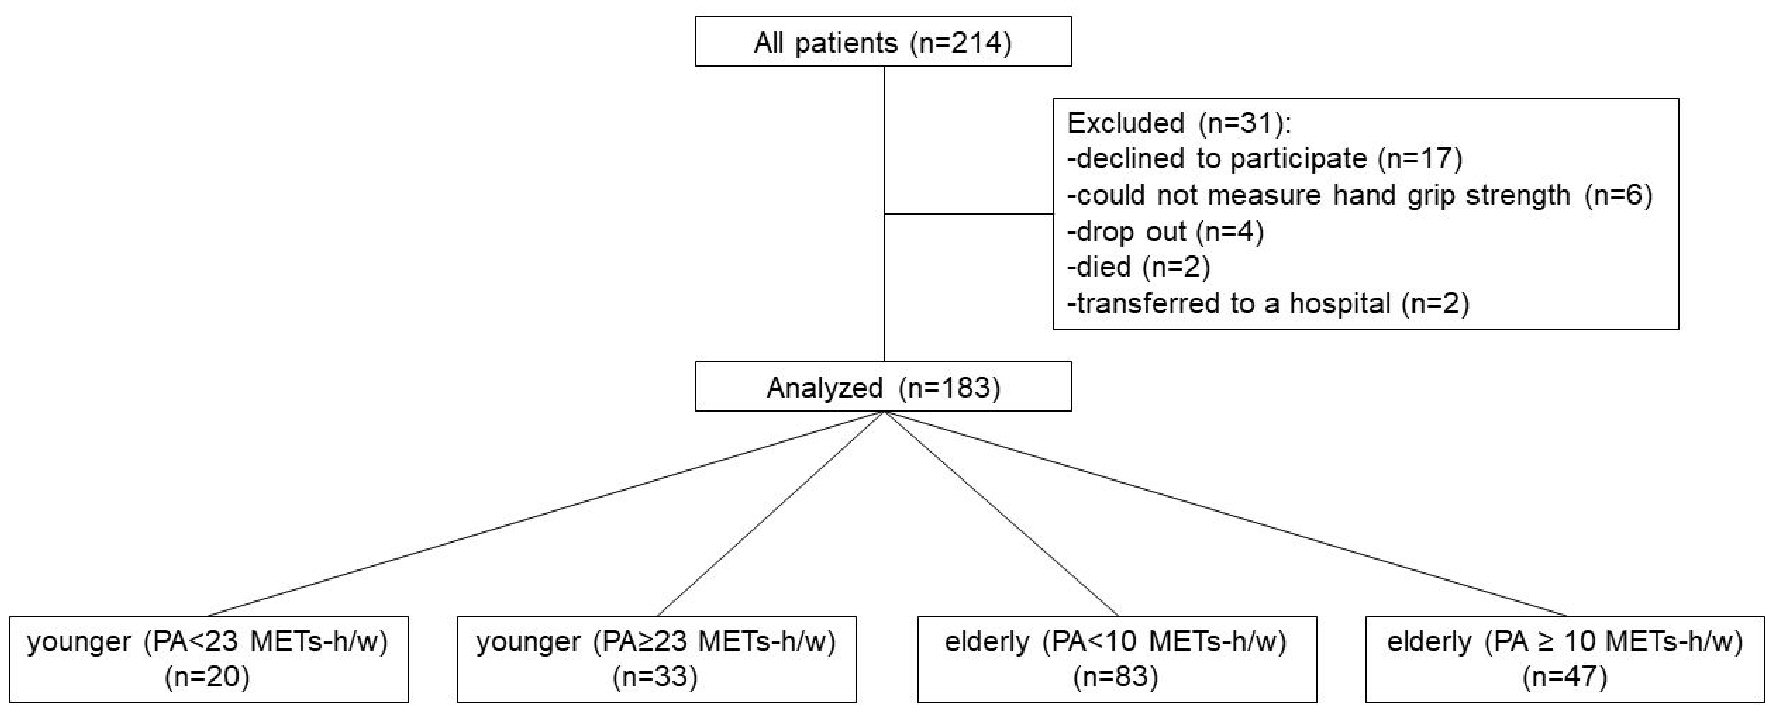
Figure 1. Flowchart indicating selection of participants and grouping according to age and PA. PA: physical activity.
| Journal of Clinical Medicine Research, ISSN 1918-3003 print, 1918-3011 online, Open Access |
| Article copyright, the authors; Journal compilation copyright, J Clin Med Res and Elmer Press Inc |
| Journal website http://www.jocmr.org |
Original Article
Volume 11, Number 10, October 2019, pages 711-719
Efficacy of Physical Activity in Prevention of Muscle Weakness in Patients With Chronic Liver Disease
Figure
Tables
| Age (years) | 69.0 (63.0, 75.0) |
|---|---|
| Data were expressed as median (interquartile range) or as n (%). ALBI: albumin-bilirubin. | |
| Male | 107 (58%) |
| Body mass index (kg/m2) | 23.41 (20.69, 25.23) |
| Etiology of liver disease | |
| Hepatitis B | 46 (25%) |
| Hepatitis C | 69 (38%) |
| Alcoholic hepatitis | 22 (12%) |
| Nonalcoholic steatohepatitis | 23 (13%) |
| Autoimmune hepatitis | 1 (< 1%) |
| Primary biliary cirrhosis | 2 (< 1%) |
| Others | 20 (11%) |
| Hepatocellular carcinoma | 42 (23%) |
| Sarcopenia | 22 (12%) |
| ALBI grade (1/2/3) | 145/37/1 |
| Branched-chain amino acids (intake) | 67 (37%) |
| Living alone (yes) | 32 (17%) |
| Currently smoking (yes) | 32 (17%) |
| Currently drinking (yes) | 41 (22%) |
| Driving of cars (usually) | 149 (81%) |
| Employment status (retired) | 94 (51%) |
| Do home tasks (yes) | 100 (55%) |
| Healthy eating (yes) | 157 (86%) |
| Exercise habits (yes) | 133 (73%) |
| Observation period (days) | 119 (96.5, 140) |
| PA < 23 METs-h/w (n = 20) | PA ≥ 23 METs-h/w (n = 33) | P value | |
|---|---|---|---|
| Data were expressed as median (interquartile range), or as n (%). Continuous variables were compared by Mann-Whitney U test. Categorical variables were compared by Fisher’s exact test. PA: physical activity; METS-h/w: metabolic equivalents-hour/week; ALBI: albumin-bilirubin. | |||
| Age (years) | 60.00 (50.25, 62.00) | 56.00 (50.00, 60.00) | 0.37 |
| Male (n) | 17 (85.0%) | 22 (66.7%) | 0.20 |
| Body mass index (kg/m2) | 22.74 (19.96, 25.69) | 23.25 (20.07, 25.47) | 0.84 |
| Hepatocellular carcinoma (n) | 2 (10.0%) | 5 (15.2%) | 0.70 |
| Sarcopenia (n) | 1 (5.0%) | 0 | 0.38 |
| ALBI grade (1/2/3) | 16/4/0 | 30/3/0 | 0.41 |
| Hand grip strength (kg) | 34.33 (29.99, 37.09) | 32.25 (25.90, 39.10) | 0.20 |
| Physical activity (METs-h/w) | 6.60 (2.47, 14.32) | 49.50 (28.00, 118.60) | < 0.01 |
| Sedentary time (h/day) | 6.00 (4.00, 10.00) | 4.00 (3.00, 6.00) | 0.01 |
| Branched-chain amino acids (intake) | 4 (20.0%) | 6 (18.2%) | > 0.99 |
| Living alone (yes) | 3 (15.0%) | 6 (18.2%) | > 0.99 |
| Currently smoking (yes) | 6 (30.0%) | 8 (24.2%) | 0.75 |
| Currently drinking (yes) | 4 (20.0%) | 9 (27.3%) | 0.74 |
| Driving of cars (usually) | 18 (90.0%) | 29 (87.9%) | > 0.99 |
| Employment status (retired) | 4 (20.0%) | 2 (6.1%) | 0.18 |
| Do home tasks (yes) | 6 (30.0%) | 19 (57.6%) | 0.09 |
| Healthy eating (yes) | 14 (70.0%) | 26 (78.8%) | 0.52 |
| Exercise habits (yes) | 11 (55.0%) | 23 (69.7%) | 0.38 |
| Observation period (days) | 101.50 (70.00, 135.25) | 119.00 (98.00, 151.00) | 0.19 |
| PA < 23 METs-h/w (n = 20) | PA ≥ 23 METs-h/w (n = 33) | P value | |
|---|---|---|---|
| Data were expressed as median (interquartile range). Continuous variables were compared by the Mann-Whitney U test. PA: physical activity; METS-h/w: metabolic equivalents-hour/week; CONUT-score: controlling nutritional status index score; Fib-4 index: fibrosis 4 index. | |||
| Serum albumin (g/dL) | 4.40 (4.18, 4.53) | 4.30 (4.20, 4.50) | 0.68 |
| Alkaline phosphatase (U/L) | 278.00 (222.50, 296.00) | 212.00 (178.00, 284.00) | 0.09 |
| Alanine transaminase (U/L) | 27.50 (20.00, 47.75) | 23.00 (17.00, 32.00) | 0.30 |
| Aspartate aminotransferase (U/L) | 29.50 (23.75, 34.25) | 25.00 (22.00, 36.00) | 0.23 |
| Blood urea nitrogen (mg/dL) | 14.05 (12.70, 15.28) | 14.80 (12.50, 15.70) | 0.70 |
| Creatine kinase (U/L) | 114.00 (84.75, 167.50) | 0.71 (0.59, 0.80) | 0.39 |
| Creatinine (mg/dL) | 0.78 (0.67, 0.84) | 0.71 (0.59, 0.80) | 0.11 |
| Cholinesterase (U/L) | 339.00 (249.50, 436.75) | 340.00 (255.00, 380.00) | 0.66 |
| Estimated glomerular filtration rate (mL/min/1.73 m2) | 78.53 (73.97, 92.24) | 86.22 (73.65, 99.36) | 0.22 |
| Hemoglobin (g/dL) | 14.10 (13.50, 15.45) | 13.90 (13.20, 15.40) | 0.59 |
| HemogobinA1c (%) | 5.70 (5.55, 5.93) | 5.90 (5.50, 6.23) | 0.34 |
| Prothrombin time-international normalized ratio | 0.99 (0.97, 1.05) | 0.98 (0.97, 1.01) | 0.53 |
| Total bilirubin (mg/dL) | 0.64 (0.54, 0.73) | 0.64 (0.48, 0.78) | 0.70 |
| Total cholesterol (mg/dL) | 163.00 (156.00, 179.50) | 177.00 (163.00, 203.00) | 0.14 |
| Total protein (g/dL) | 7.45 (6.97, 7.73) | 7.20 (7.10, 7.60) | 0.58 |
| Triglyceride (mg/dL) | 83.50 (55.75, 104.00) | 94.00 (80.00, 115.00) | 0.16 |
| Red blood cell count (× 104/µL) | 460.50 (430.75, 488.00) | 455.00 (411.00, 497.00) | 0.89 |
| White blood cell count (× 102/µL) | 54.50 (47.75, 62.75) | 53.00 (42.00, 69.00) | 0.77 |
| Total lymphocyte count | 1,573.60 (1,192.38, 1,980.75) | 1,824.90 (1,167.90, 2,356.00) | 0.26 |
| Platelet count (× 104) | 20.20 (17.72, 26.02) | 21.90 (16.80, 24.50) | 0.92 |
| CONUT-score | 1.00 (1.00, 2.25) | 1.00 (0.00, 2.00) | 0.56 |
| Fib-4 index | 1.40 (1.16, 1.89) | 1.35 (0.96, 2.06) | 0.78 |
| PA < 23 METs-h/w (n = 20) | PA ≥ 23 METs-h/w (n = 33) | P value | |
|---|---|---|---|
| Data were expressed as median (interquartile range). Variables were compared by the Mann-Whitney U test. PA: physical activity; METS-h/w: metabolic equivalents-hour/week. | |||
| Changes in hand grip strength (kg) | -0.02 (-1.83, 1.47) | 0.25 (-2.45, 2.05) | 0.96 |
| Rate of change (%) | -0.06 (-5.85, 4.43) | 0.69 (-6.76, 6.39) | 0.99 |
| PA < 10 METs-h/w (n = 47) | PA ≥ 10 METs-h/w (n = 83) | P value | |
|---|---|---|---|
| Data were expressed as median (interquartile range), or as n (%). Continuous variables were compared by Mann-Whitney U test. Categorical variables were compared by Fisher’s exact test. PA: physical activity; METS-h/w: metabolic equivalents-hour/week; ALBI: albumin-bilirubin. | |||
| Age (years) | 73.00 (68.50, 78.00) | 71.00 (68.00, 77.00) | 0.32 |
| Male (n) | 22 (46.8%) | 46 (55.4%) | 0.37 |
| Body mass index (kg/m2) | 22.91 (20.41, 24.75) | 23.44 (21.09, 25.24) | 0.34 |
| Hepatocellular carcinoma (n) | 14 (29.8%) | 21 (25.3%) | 0.68 |
| Sarcopenia (n) | 15 (31.9%) | 6 (7.2%) | < 0.01 |
| ALBI grade (1/2/3) | 34/12/1 | 65/18/0 | 0.42 |
| Hand grip strength (kg) | 22.95 (17.82, 31.00) | 27.05 (21.80, 33.73) | < 0.01 |
| Physical activity (METS-h/w) | 4.40 (1.65, 6.60) | 25.10 (15.62, 49.70) | < 0.01 |
| Sedentary time (h/day) | 7.00 (5.00, 10.00) | 5.00 (3.00, 6.00) | < 0.01 |
| Branched-chain amino acids (intake) | 19 (40.4%) | 38 (45.8%) | 0.59 |
| Living alone (yes) | 13 (27.7%) | 10 (12.0%) | 0.03 |
| Currently smoking (yes) | 5 (10.6%) | 13 (15.7%) | 0.60 |
| Currently drinking (yes) | 9 (19.1%) | 19 (22.9%) | 0.66 |
| Driving of cars (usually) | 35 (74.5%) | 67 (80.7%) | 0.51 |
| Employment status (retired) | 37 (78.7%) | 51 (61.4%) | 0.05 |
| Do home tasks (yes) | 30 (63.8%) | 45 (54.2%) | 0.36 |
| Healthy eating (yes) | 42 (89.4%) | 75 (90.4%) | > 0.99 |
| Exercise habits (yes) | 26 (55.3%) | 73 (88.0%) | < 0.01 |
| Observation period (days) | 126.00 (105.00, 147.00) | 112.00 (91.00, 140.00) | 0.05 |
| PA < 10 METs-h/w (n = 47) | PA ≥ 10 METs-h/w (n = 83) | P value | |
|---|---|---|---|
| Data were expressed as median (interquartile range). Continuous variables were compared by Mann-Whitney U test. CONUT-score: controlling nutritional status index score; Fib-4 index: fibrosis 4 index. PA: physical activity; METS-h/w: metabolic equivalents-hour/week. | |||
| Serum albumin (g/dL) | 4.10 (3.75, 4.30) | 4.20 (3.90, 4.40) | 0.20 |
| Alkaline phosphatase (U/L) | 246.00 (206.00, 323.00) | 247.00 (196.50, 327.50) | 0.97 |
| Alanine transaminase (U/L) | 14.00 (11.00, 19.50) | 17.00 (13.50, 21.50) | 0.08 |
| Aspartate aminotransferase (U/L) | 23.00 (19.50, 28.00) | 25.00 (21.00, 31.00) | 0.23 |
| Blood urea nitrogen (mg/dL) | 17.30 (13.85, 19.65) | 15.50 (13.30, 18.10) | 0.05 |
| Creatine kinase (U/L) | 90.00 (71.50, 124.50) | 107.00 (76.50, 156.00) | 0.048 |
| Creatinine (mg/dL) | 0.73 (0.57, 0.89) | 0.71 (0.62, 0.81) | 0.70 |
| Cholinesterase (U/L) | 270.00 (212.50, 326.00) | 288.00 (243.00, 340.75) | 0.29 |
| Estimated glomerular filtration rate (mL/min/1.73m2) | 68.79 (58.30, 85.77) | 71.78 (65.50, 81.37) | 0.36 |
| Hemoglobin (g/dL) | 13.30 (12.15, 14.75) | 13.20 (12.20, 14.15) | 0.46 |
| HemogobinA1c (%) | 5.90 (5.50, 6.30) | 5.80 (5.60, 6.10) | 0.12 |
| Prothrombin time-international normalized ratio | 0.98 (0.97, 1.07) | 1.00 (0.97, 1.05) | 0.46 |
| Total bilirubin (mg/dL) | 0.58 (0.46, 0.74) | 0.66 (0.50, 0.88) | 0.12 |
| Total cholesterol (mg/dL) | 180.00 (163.00, 200.00) | 178.00 (159.50, 199.50) | 0.67 |
| Total protein (g/dL) | 7.50 (7.00, 7.60) | 7.30 (7.10, 7.75) | 0.81 |
| Triglyceride (mg/dL) | 111.00 (74.50, 139.50) | 92.00 (68.00, 129.00) | 0.18 |
| Red blood cell count (× 104/µL) | 432.00 (394.00, 478.00) | 421.00 (395.50, 458.00) | 0.37 |
| White blood cell count (× 102/µL) | 52.00 (39.50, 63.00) | 54.00 (42.50, 64.00) | 0.66 |
| Total lymphocyte count | 1,348.10 (1,091.10, 1,754.40) | 1,510.50 (1,176.10, 2,008.85) | 0.13 |
| Platelet count (× 104) | 19.10 (14.00, 23.10) | 19.10 (14.85, 23.60) | 0.91 |
| CONUT-score | 2.00 (1.00, 3.00) | 1.00 (1.00, 2.00) | 0.26 |
| Fib-4 index | 2.48 (1.95, 3.60) | 2.44 (1.85, 3.04) | 0.76 |
| Low PA (n = 47) | High PA (n = 83) | P value | |
|---|---|---|---|
| Data were expressed as median (interquartile range). Variables were compared by Mann-Whitney U test. PA: physical activity. | |||
| Changes in hand grip strength (kg) | -1.00 (-2.27, 0.55) | 0.10 (-1.40, 1.10) | 0.02 |
| Rate of change (%) | -5.24 (-8.59, 2.94) | 0.44 (-4.17, 4.66) | 0.03 |
| Variables | Univariate analysis | Multivariate analysis | ||||
|---|---|---|---|---|---|---|
| OR | 95% CI | P value | OR | 95% CI | P value | |
| Data were analyzed by logistic regression analysis model. HGS: hand grip strength; OR: odds ratio; CI: confidence interval; ALBI: albumin-bilirubin; METs: metabolic equivalents-hour/week. | ||||||
| Age (< 65/≥ 65) | 1.15 | 0.58 - 2.31 | 0.74 | 1.09 | 0.55 - 2.17 | 0.80 |
| Sex (male/female) | 1.11 | 0.59 - 2.09 | 0.77 | 0.95 | 0.52 - 1.76 | 0.89 |
| ALBI grade (1/2 or 3) | 0.89 | 0.41 - 1.93 | 0.86 | 0.78 | 0.34 - 1.79 | 0.55 |
| Branched-amino acids supplementation (yes/no) | 1.03 | 0.54 - 1.97 | > 0.99 | 1.09 | 0.53 - 2.24 | 0.82 |
| Hepatocellular carcinoma (absence/presence) | 1.12 | 0.53 - 2.36 | 0.86 | 0.86 | 0.41 - 1.79 | 0.69 |
| Physical activity (≥ 10METs-h/w/< 10METs-h/w) | 1.85 | 0.95 - 3.66 | 0.06 | 1.91 | 1.00 - 3.62 | 0.049 |