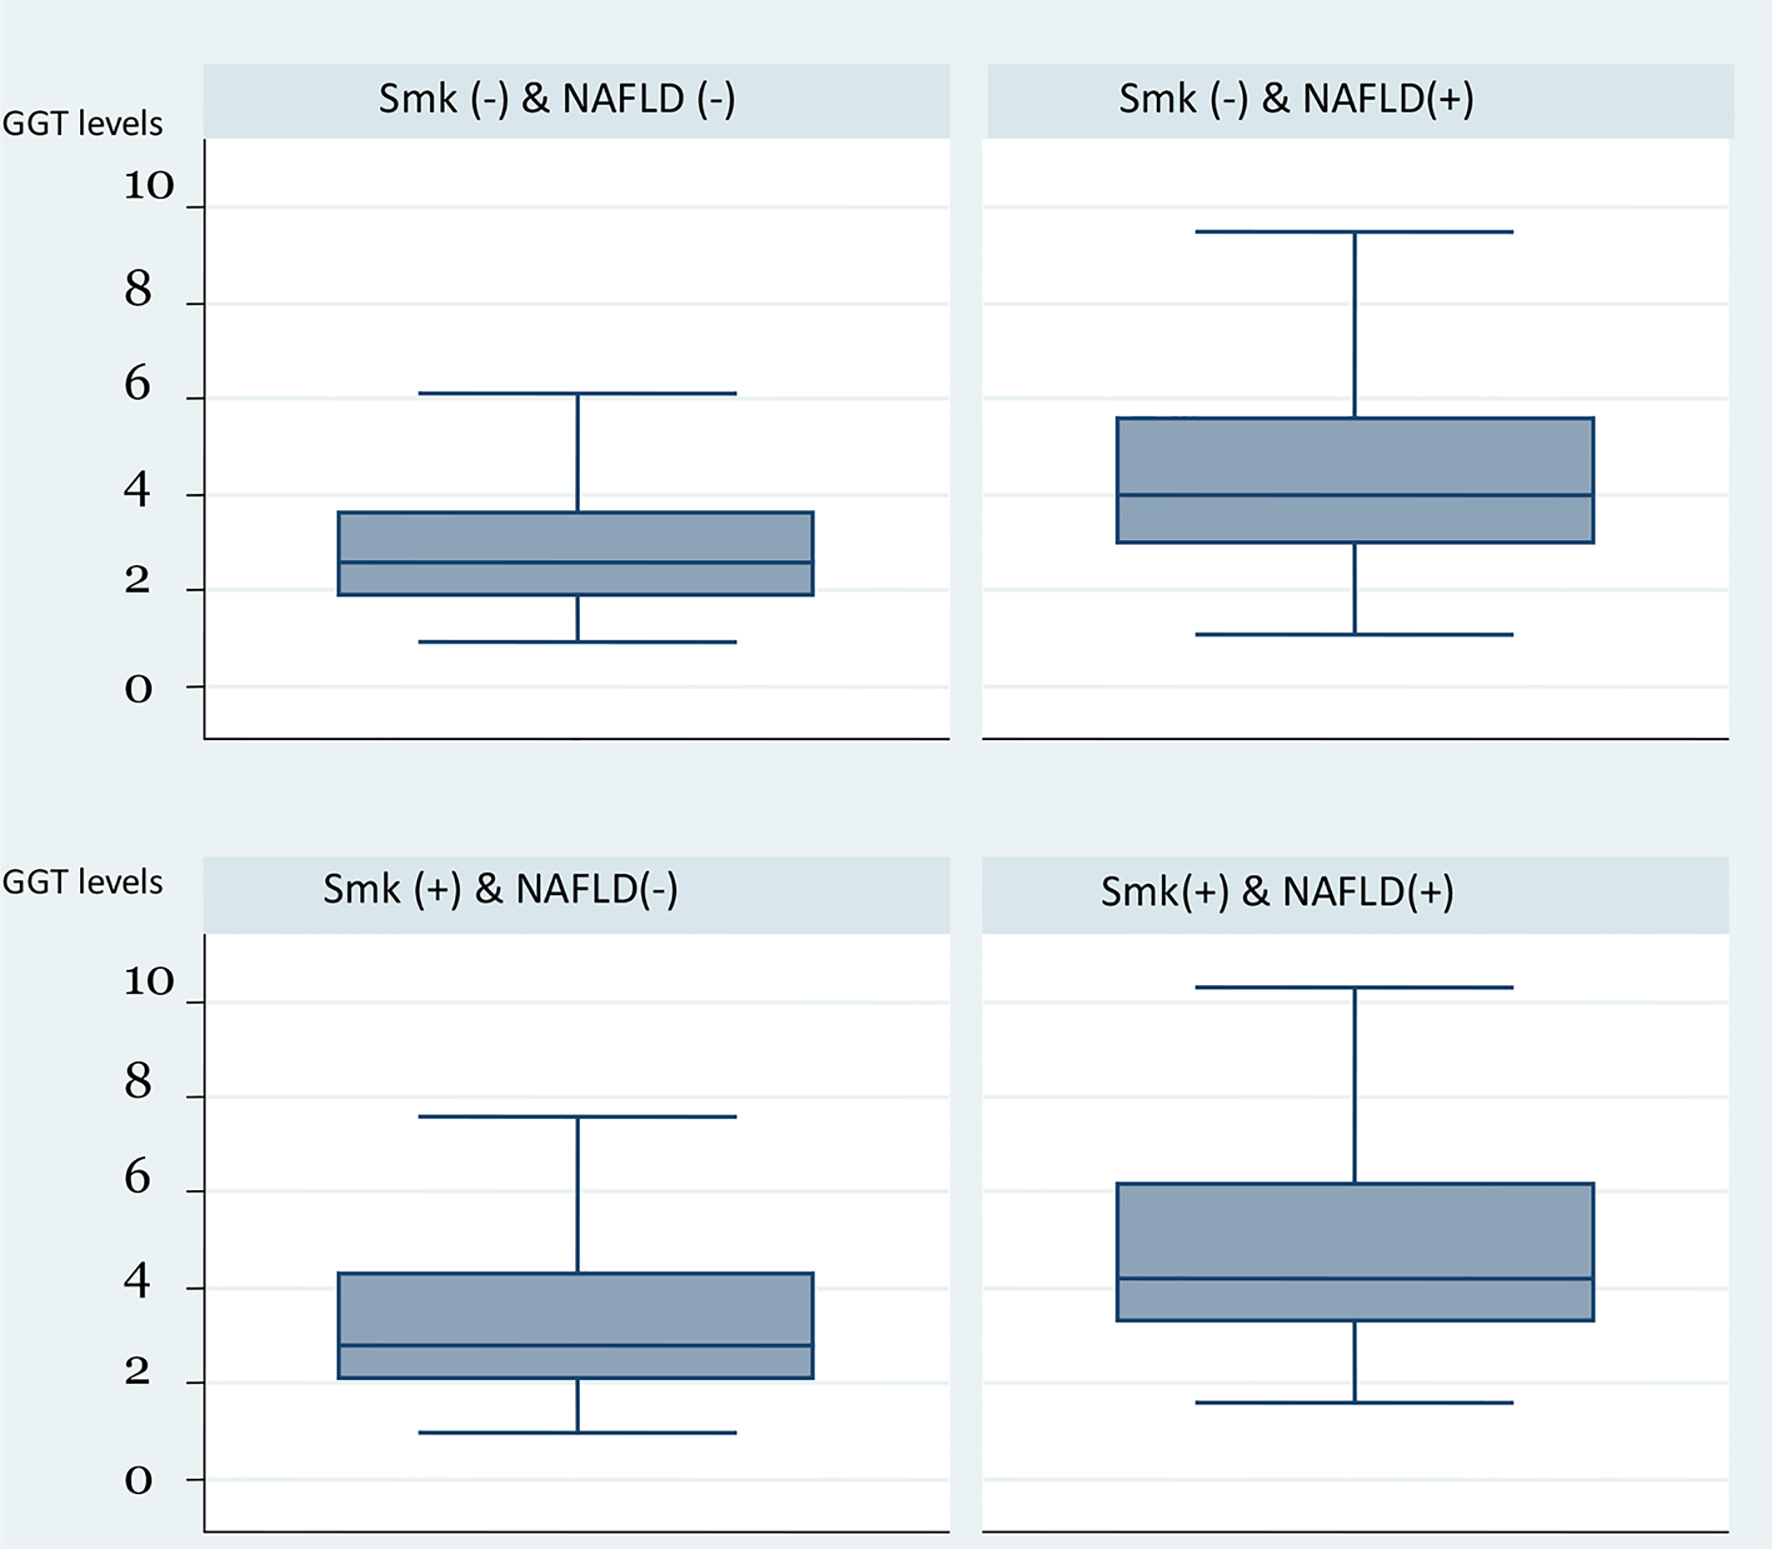
Figure 1. Box plot of GGT levels by the combination of smoking status and presence of HS. GGT: gamma-glutamyl transferase; HS: hepatic steatosis.
| Journal of Clinical Medicine Research, ISSN 1918-3003 print, 1918-3011 online, Open Access |
| Article copyright, the authors; Journal compilation copyright, J Clin Med Res and Elmer Press Inc |
| Journal website http://www.jocmr.org |
Original Article
Volume 12, Number 8, August 2020, pages 472-482
Non-Alcoholic Fatty Liver Disease Modifies Serum Gamma-Glutamyl Transferase in Cigarette Smokers
Figures
Tables
| Clinical, anthropometric and biochemical characteristics | Smokers (-) and NAFLD (-) (N = 3,731) | Smokers (-) and NAFLD (+) (N = 2,060) | Smokers (+) and NAFLD (-) (N = 324) | Smokers (+) and NAFLD (+) (N = 239) | P-value |
|---|---|---|---|---|---|
| NAFLD: non-alcoholic fatty liver disease; BMI: body mass index; SD: standard deviation; SBP: systolic blood pressure; DBP: diastolic blood pressure; HTN: hypertension; ALT: alanine aminotransferase; AST: aspartate aminotransferase; GGT: gamma-glutamyl transferase; HDL-C: high-density lipoprotein cholesterol; LDL: low-density lipoprotein; FBG: fasting blood glucose; hs-CRP: high-sensitivity C-reactive protein; TG: triglycerides. | |||||
| Male (%) | 71 | 94 | 70 | 95 | < 0.001 |
| Mean age, years (± SD) | 42 (9) | 46 (9) | 42 (10) | 47 (9) | < 0.001 |
| Mean BMI, kg/m2 (± SD) | 25 (3) | 29 (4) | 25 (3) | 29 (3) | < 0.001 |
| Mean waist circumference, cm (± SD) | 87 (10) | 100 (10) | 87 (11) | 100 (9) | < 0.001 |
| Obesity, BMI ≥ 30 kg/m2 (%) | 9 | 46 | 12 | 45 | < 0.001 |
| Mean SBP, mm Hg (± SD) | 116 (12) | 124 (12) | 116 (12) | 124 (12) | < 0.001 |
| Mean DBP, mm Hg (± SD) | 75 (8) | 80 (7) | 75 (8) | 80 (8) | < 0.001 |
| HTN present (%) | 8 | 22 | 8 | 21 | < 0.001 |
| Median AST, IU/L (interquartile range) | 27 (24 - 32) | 32 (28 - 39) | 26 (23 - 31) | 30 (26 - 37) | < 0.001 |
| Median ALT, IU/L (interquartile range) | 29 (23 - 37) | 43 (33 - 56) | 28 (21 - 36) | 39 (31 - 53) | < 0.001 |
| Median GGT, IU/L (interquartile range) | 26 (19 - 36) | 40 (30 - 56) | 28 (21 - 43) | 42 (33 - 62) | < 0.001 |
| Median TG, mg/dL (interquartile range) | 99 (74 - 136) | 149 (109 - 208) | 113 (84 - 163) | 179 (124 - 240) | < 0.001 |
| Mean HDL, mg/dL (± SD) | 52 (14) | 43 (10) | 49 (13) | 42 (10) | < 0.001 |
| Mean LDL, mg/dL (± SD) | 128 (32) | 136 (34) | 129 (35) | 135 (34) | < 0.001 |
| Mean FBG, mg/dL (± SD) | 87 (9) | 93 (12) | 87 (9) | 93 (12) | < 0.001 |
| Median hs-CRP, mg/L (interquartile range) | 1 (0.5 - 0.9) | 1.7 (0.9 - 3) | 1.2 (0.5 - 2.6) | 1.8 (1 - 3.5) | < 0.001 |
| High hs-CRP (≥ 3 mg/L) (%) | 28 | 36 | 32 | 41 | < 0.001 |
| Mean uric acid, mg/dL (± SD) | 5.4 (4.4 - 6.3) | 6.4 (5.7 - 7.2) | 5.4 (4.6 - 6.4) | 6.3 (5.6 - 7) | < 0.001 |
| Antihypertensive (%) | 8 | 21 | 7 | 21 | < 0.001 |
| Lipid lowering medication (%) | 7 | 12 | 7 | 14 | < 0.001 |
| Subjects with metabolic syndrome (%) | 8 | 41 | 11 | 46 | < 0.001 |
| Median TG/HDL-C (interquartile range) | 1.9 (1.3 - 3) | 3.5 (2.4 - 5.4) | 2.4 (1.5 - 3.8) | 4.4 (2.8 - 6.5) | < 0.001 |
| Total (standardized coefficient) | HS+ (standardized coefficient) | HS- (standardized coefficient) | Interaction (HS-smoking) | |
|---|---|---|---|---|
| *P < 0.05, **P < 0.005, ***P < 0.001. Model 1: unadjusted. Model 2: adjusted for age, gender. Model 3: model 2 + SBP, waist circumference, fasting glucose, lipid lowering medications, hypertension meds, LDL-C, AST, alcohol consumption and C-reactive protein. GGT: gamma-glutamyl transferase; NAFLD: non-alcoholic fatty liver disease; HS: hepatic steatosis; SBP: systolic blood pressure; LDL-C: low-density lipoprotein cholesterol; AST: aspartate aminotransferase. | ||||
| Model 1 | 6.83 (3.69 - 9.96)*** | 10.31 (4.68 - 15.95)*** | 2.36 (-1.14 - 5.85) | P = 0.012 |
| Model 2 | 6.51 (3.46 - 9.56)*** | 10.19 (4.57 - 15.81)*** | 2.57 (-0.83 - 5.9) | P = 0.015 |
| Model 3 | 4.65 (1.61 - 7.69)** | 11.12 (5.76 - 16.48)*** | -0.02 (-3.59 - 3.56) | P < 0.001 |
| Obesity+ (standardized coefficient) | Obesity- (standardized coefficient) | Interaction (obesity-smoking) | |
|---|---|---|---|
| *P < 0.05, **P < 0.005, ***P < 0.001. Model 1: unadjusted. Model 2: adjusted for age, gender. Model 3: model 2 + SBP, fasting glucose, lipid lowering medications, hypertension meds, LDL-C, AST, alcohol consumption and C-reactive protein. GGT: gamma-glutamyl transferase; SBP: systolic blood pressure; LDL-C: low-density lipoprotein cholesterol; AST: aspartate aminotransferase. | |||
| Model 1 | 11.14 (3.24 - 19.03)* | 4.65 (1.43 - 7.87)* | P = 0.072 |
| Model 2 | 10.46 (2.64 - 18.27)* | 4.60 (1.48 - 7.73)** | P = 0.096 |
| Model 3 | 12.73 (5.5 - 19.96)** | 1.74 (-1.45 - 4.94) | P < 0.001 |