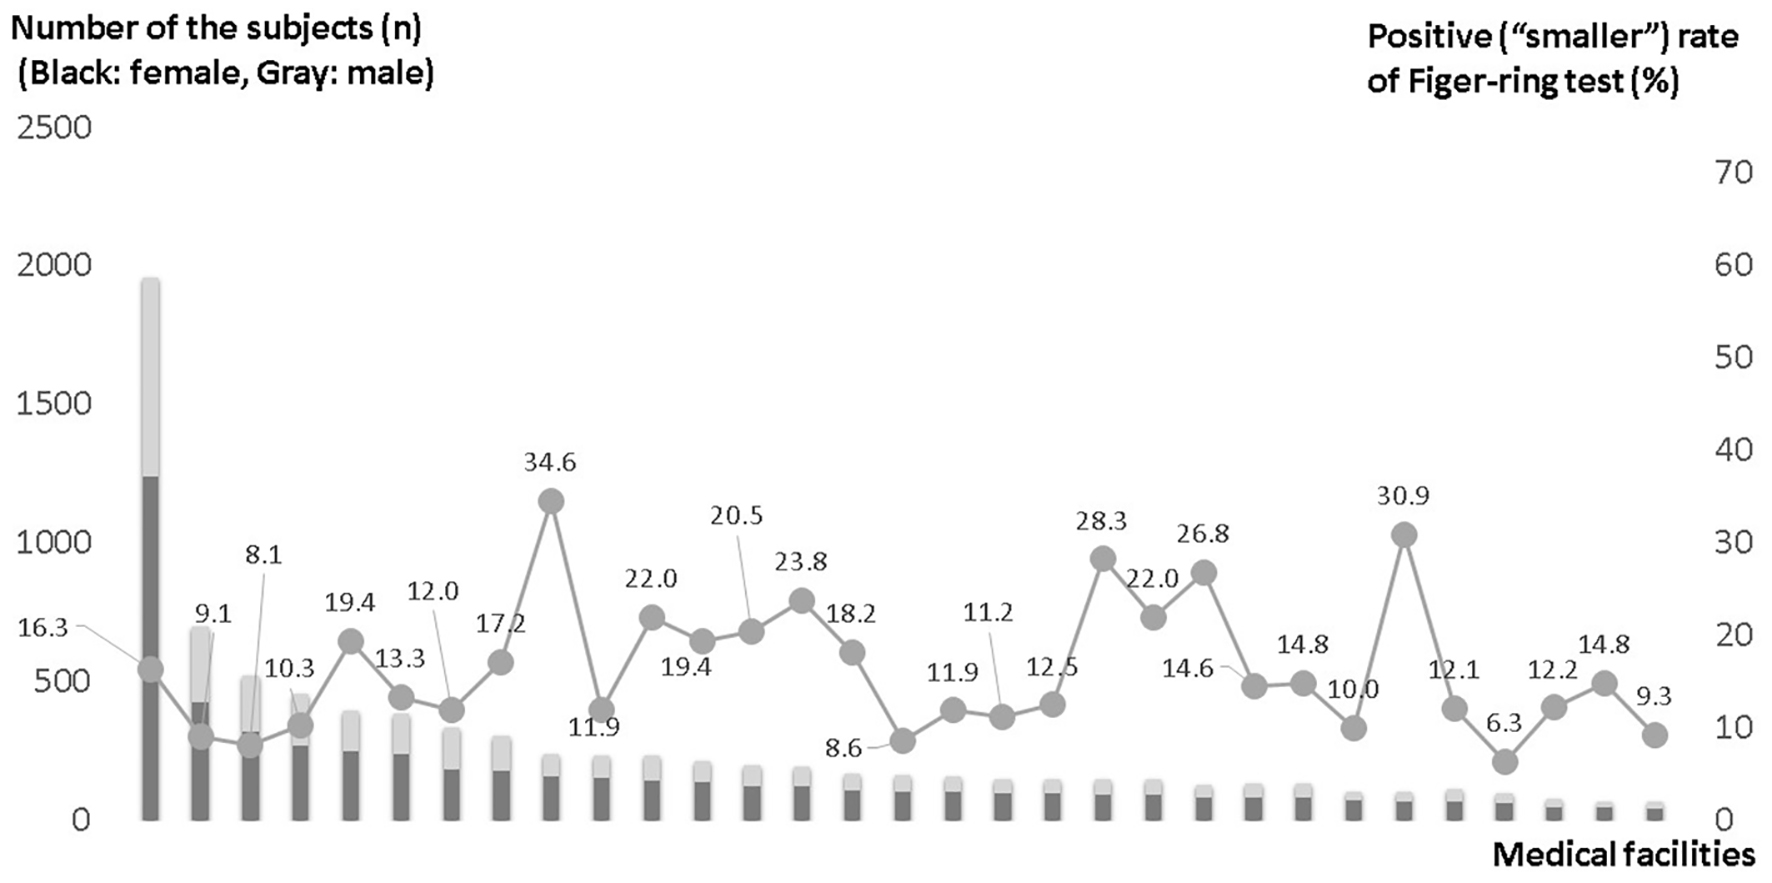
Figure 1. Positive rate of finger-ring test among medical facilities.
| Journal of Clinical Medicine Research, ISSN 1918-3003 print, 1918-3011 online, Open Access |
| Article copyright, the authors; Journal compilation copyright, J Clin Med Res and Elmer Press Inc |
| Journal website http://www.jocmr.org |
Original Article
Volume 11, Number 9, September 2019, pages 623-628
“Yubi-wakka” (Finger-Ring) Test: A Tool to Detect Prefrailty in Elderly Populations, a Pilot Study
Figure
Tables
| Male | ||||
|---|---|---|---|---|
| n (%) | 2,129 (39.4) | |||
| Finger-ring test | Larger | Just fit | Smaller | Sum |
| 65 - 69 years old | 370 (43.0) | 381 (44.3) | 110 (12.8) | 861 (100, 40.4) |
| 70 - 74 years old | 489 (38.6) | 594 (46.8) | 185 (14.6) | 1,268 (100, 59.6) |
| Sum | 859 (40.3) | 975 (45.8) | 295 (13.9) | 2,129 (100, 100) |
| Female | ||||
| n (%) | 3,276 (60.6) | |||
| Finger-ring test | Larger | Just fit | Smaller | Sum |
| 65 - 69 years old | 541 (36.8) | 690 (46.9) | 240 (16.3) | 1,471 (100, 44.9) |
| 70 - 74 years old | 696 (38.6) | 802 (44.4) | 307 (17.0) | 1,805 (100, 55.1) |
| Sum | 1,237 (37.8) | 1,492 (45.5) | 547 (16.7) | 3,276 (100, 100) |
| All | ||||
| n (%) | 5,405 (100) | |||
| Finger-ring test | Larger | Just fit | Smaller | Sum |
| 6 5- 69 years old | 911 (39.1) | 1,071 (45.9) | 350 (15.0) | 2,332 (100, 43.1) |
| 70 - 74 years old | 1,185 (38.6) | 1,396 (45.4) | 492 (16.0) | 3,073 (100, 56.9) |
| Sum | 2,096 (38.8) | 2,467 (45.6) | 842 (15.6) | 5,405 (100, 100) |
| Male | Female | |||||
|---|---|---|---|---|---|---|
| Larger | Smaller | P-value | Larger | Smaller | P-value | |
| Data are means. *Significantly higher than those which in the other group. | ||||||
| n | 859 | 295 | 1,237 | 547 | ||
| Age (years) | 70.1 | 70.5* | 0.036* | 70.1 | 70.2 | 0.289 |
| Body height (cm) | 165.8 | 166.7* | 0.022* | 151.9 | 152.8* | 0.002* |
| Body weight (kg) | 68.6* | 58.0 | 0.000* | 55.4* | 46.0 | 0.000* |
| Body mass index | 24.9* | 20.8 | 0.000* | 24.0* | 19.7 | 0.000* |
| Waist circumference (cm) | 89.1* | 79.2 | 0.000* | 85.4* | 75.1 | 0.000* |
| Change in body weight over 3 years (dBW 3 years) (kg) | 0.2* | -0.9 | 0.000* | 0.3* | -0.6 | 0.000* |
| dBW 5 years (kg) | 0.2* | -1.2 | 0.000* | 0.2* | -0.8 | 0.000* |
| Body weight 2012 (kg) | 67.9* | 58.8 | 0.000* | 55.3* | 46.5 | 0.000* |
| Body weight 2014 (kg) | 68.1* | 58.4 | 0.000* | 55.1* | 46.4 | 0.000* |
| Body mass index 2012 | 24.6* | 21.1 | 0.000* | 23.7* | 19.7 | 0.000* |
| Body mass index 2014 | 24.6* | 21.0 | 0.000* | 23.8* | 19.8 | 0.000* |
| Systolic blood pressure (mm Hg) | 130.7 | 130.5 | 0.877 | 129.3* | 126.8 | 0.0003* |
| Diastolic blood pressure (mm Hg) | 76.0 | 75.4 | 0.356 | 73.5* | 72.0 | 0.004* |
| Male | Female | |||||
|---|---|---|---|---|---|---|
| Larger | Smaller | P-value | Larger | Smaller | P-value | |
| Data are means. *Significantly higher than those which in the other group. | ||||||
| Hemoglobin A1c (%) | 5.9* | 5.8 | 0.009* | 5.8* | 5.6 | 0.000* |
| Fasting plasma glucose (mg/dL) | 104.8 | 101.7 | 0.090 | 100.6* | 94.5 | 0.000* |
| Red blood cell (× 104/mm3) | 469.8* | 457.5 | 0.000* | 442.6* | 437.2 | 0.004* |
| Hb (g/dL) | 14.7* | 14.4 | 0.000* | 13.4 | 13.3 | 0.262 |
| Ht (%) | 44.6* | 43.7 | 0.000* | 41.4 | 41.1 | 0.076 |
| High-density lipoprotein (mg/dL) | 55.7 | 62.5* | 0.000* | 65.7 | 72.3* | 0.000* |
| Low-density lipoprotein (mg/dL) | 116.8* | 111.1 | 0.002* | 125.9 | 126.5 | 0.650 |
| Triacylglycerols (mg/dL) | 135.6* | 112.5 | 0.000* | 112.4* | 99.2 | 0.000* |
| Cr (mg/dL) | 0.9 | 0.9 | 0.665 | 0.7* | 0.6 | 0.031* |
| Estimated glomerular filtration rate (mL/min/1.73 m2) | 67.9 | 72.0* | 0.000* | 70.5 | 72.8* | 0.002* |
| Creatinine clearance (mL/min) | 77.6* | 68.4 | 0.000* | 72.7* | 61.9 | 0.000* |
| Creatine kinase (mg/dL) | 146.5* | 123.5 | 0.000* | 110.4 | 106.4 | 0.302 |
| Albumin (mg/dL) | 4.3* | 4.2 | 0.000* | 4.3 | 4.3 | 0.854 |
| Aspartate aminotransferase (IU/L) | 26.1 | 25.5 | 0.391 | 25.8 | 24.0 | 0.331 |
| Alanine aminotransferase (IU/L) | 24.7* | 19.5 | 0.000* | 21.6* | 17.8 | 0.000* |
| Gamma glutamyl transpeptidase (IU/L) | 45.0 | 51.8* | 0.000* | 28.8* | 26.0 | 0.033* |
| Alkaline phosphatase (mg/dL) | 208.3 | 230.1* | 0.000* | 228.7* | 221.2 | 0.026* |
| Amylase (mg/dL) | 85.1 | 94.0* | 0.000* | 81.9 | 91.3* | 0.000* |
| Uric acid (mg/dL) | 6.0* | 5.8 | 0.001* | 4.9* | 4.6 | 0.000* |
| Fe (mg/dL) | 110.8 | 108.1 | 0.261 | 100.2 | 100.2 | 0.074 |
| Male | Female | |||||
|---|---|---|---|---|---|---|
| Larger | Smaller | P-value | Larger | Smaller | P-value | |
| Metabolic syndrome: central obesity (85 cm for male and 90 cm for female) with any two of triacylglycerol ≥ 150 mg/dL; high-density lipoprotein < 40 mg/dL; systolic blood pressure ≥ 130 mm Hg and/or diastolic blood pressure ≥ 85 mm Hg; and fasting glucose ≥ 110 mg/dL. Pre-metabolic syndrome: central obesity with one positive among others. | ||||||
| No | 36 | 82.7 | 0.001 | 73.3 | 96.3 | 0.001 |
| Pre-metabolic syndrome | 22.9 | 7.1 | 0 | 0 | ||
| Metabolic syndrome | 41.1 | 10.2 | 17.9 | 2.2 | ||
| Hazard ratio | P-value | |
|---|---|---|
| Male (R2 = 0.520, n = 936) | ||
| Urinary glucose | 1.528 | 0.0320 |
| Aspartate aminotransferase | 1.046 | 0.0260 |
| Systolic blood pressure | 1.019 | 0.0390 |
| Alanine aminotransferase | 0.965 | 0.0290 |
| Body mass index | 0.526 | 0.0001 |
| Female (R2 = 0.505, n = 1,411) | ||
| Smoking | 2.563 | 0.0020 |
| Hb | 1.384 | 0.0001 |
| Age | 1.063 | 0.0280 |
| Body mass index | 0.537 | 0.0001 |