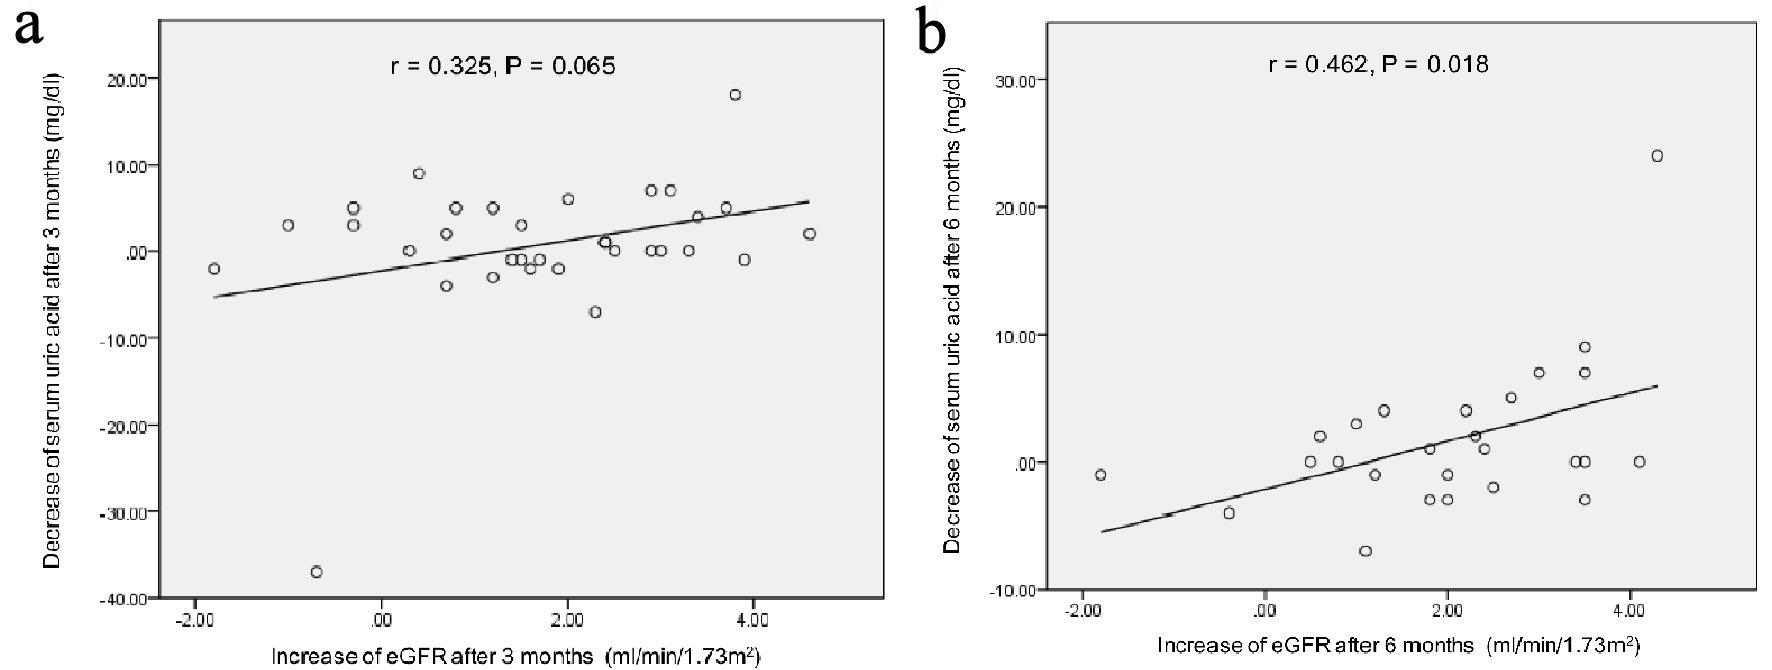
Figure 1. Correlation between the decrease of serum uric acid levels and the increase of eGFR at 3 (a) and 6 months (b) after the start of topiroxostat. r: Pearson’s correlation coefficient.
| Journal of Clinical Medicine Research, ISSN 1918-3003 print, 1918-3011 online, Open Access |
| Article copyright, the authors; Journal compilation copyright, J Clin Med Res and Elmer Press Inc |
| Journal website http://www.jocmr.org |
Letter to the Editor
Volume 11, Number 8, August 2019, pages 614-616
Renoprotective Effect of Xanthine Oxidase Inhibitor, Topiroxostat
Figure
Tables
| Sex (male, n (%)) | 27 (65.9%) |
| Age (years) | 64.4 ± 11.8 |
| Body height (cm) | 162.5 ± 8.1 |
| Body weight (kg) | 69.8 ± 15.2 |
| Body mass index (kg/m2) | 26.3 ± 5.0 |
| Systolic blood pressure (mm Hg) | 131.0 ± 25.1 |
| Diastolic blood pressure (mm Hg) | 72.6 ± 19.3 |
| Serum uric acid (mg/dL) | 8.4 ± 1.5 |
| HbA1c (%) | 6.2 ± 0.8 |
| Estimated glomerular filtration rate (mL/min/1.73m2) | 49.9 ± 18.6 |
| After 3 months | After 6 months | |||||||
|---|---|---|---|---|---|---|---|---|
| N | Baseline | After 3 month | P values | N | Baseline | After 6 month | P values | |
| The paired t-test and Fisher’s exact probability test were used to statistically analyze comparison in serum uric acid and eGFR, and comparison in positive rate of urinary protein, respectively. | ||||||||
| Serum uric acid (mg/dL) | 35 | 8.3 ± 1.4 | 6.5 ± 2.0 | < 0.001 | 26 | 8.2 ± 1.3 | 6.2 ± 1.8 | < 0.001 |
| eGFR (mL/min/1.73m2) | 36 | 49.1 ± 18.8 | 50.3 ± 20.0 | 0.368 | 28 | 47.6 ± 19.1 | 49.9 ± 20.0 | 0.063 |
| Positivity for urinary protein (n, %) | 23 | 13 (56.5%) | 11 (47.8%) | 0.002 | 23 | 13 (56.5%) | 8 (34.8%) | 0.003 |