Journal of Clinical Medicine Research, ISSN 1918-3003 print, 1918-3011 online, Open Access
Article copyright, the authors; Journal compilation copyright, J Clin Med Res and Elmer Press Inc
Journal website http://www.jocmr.org

Original Article

Volume 11, Number 10, October 2019, pages 676-681


Ezetimibe Monotherapy Reduces Serum Levels of Platelet-Activating Factor Acetylhydrolase in Patients With Dyslipidemia

Figure

Figure 1.
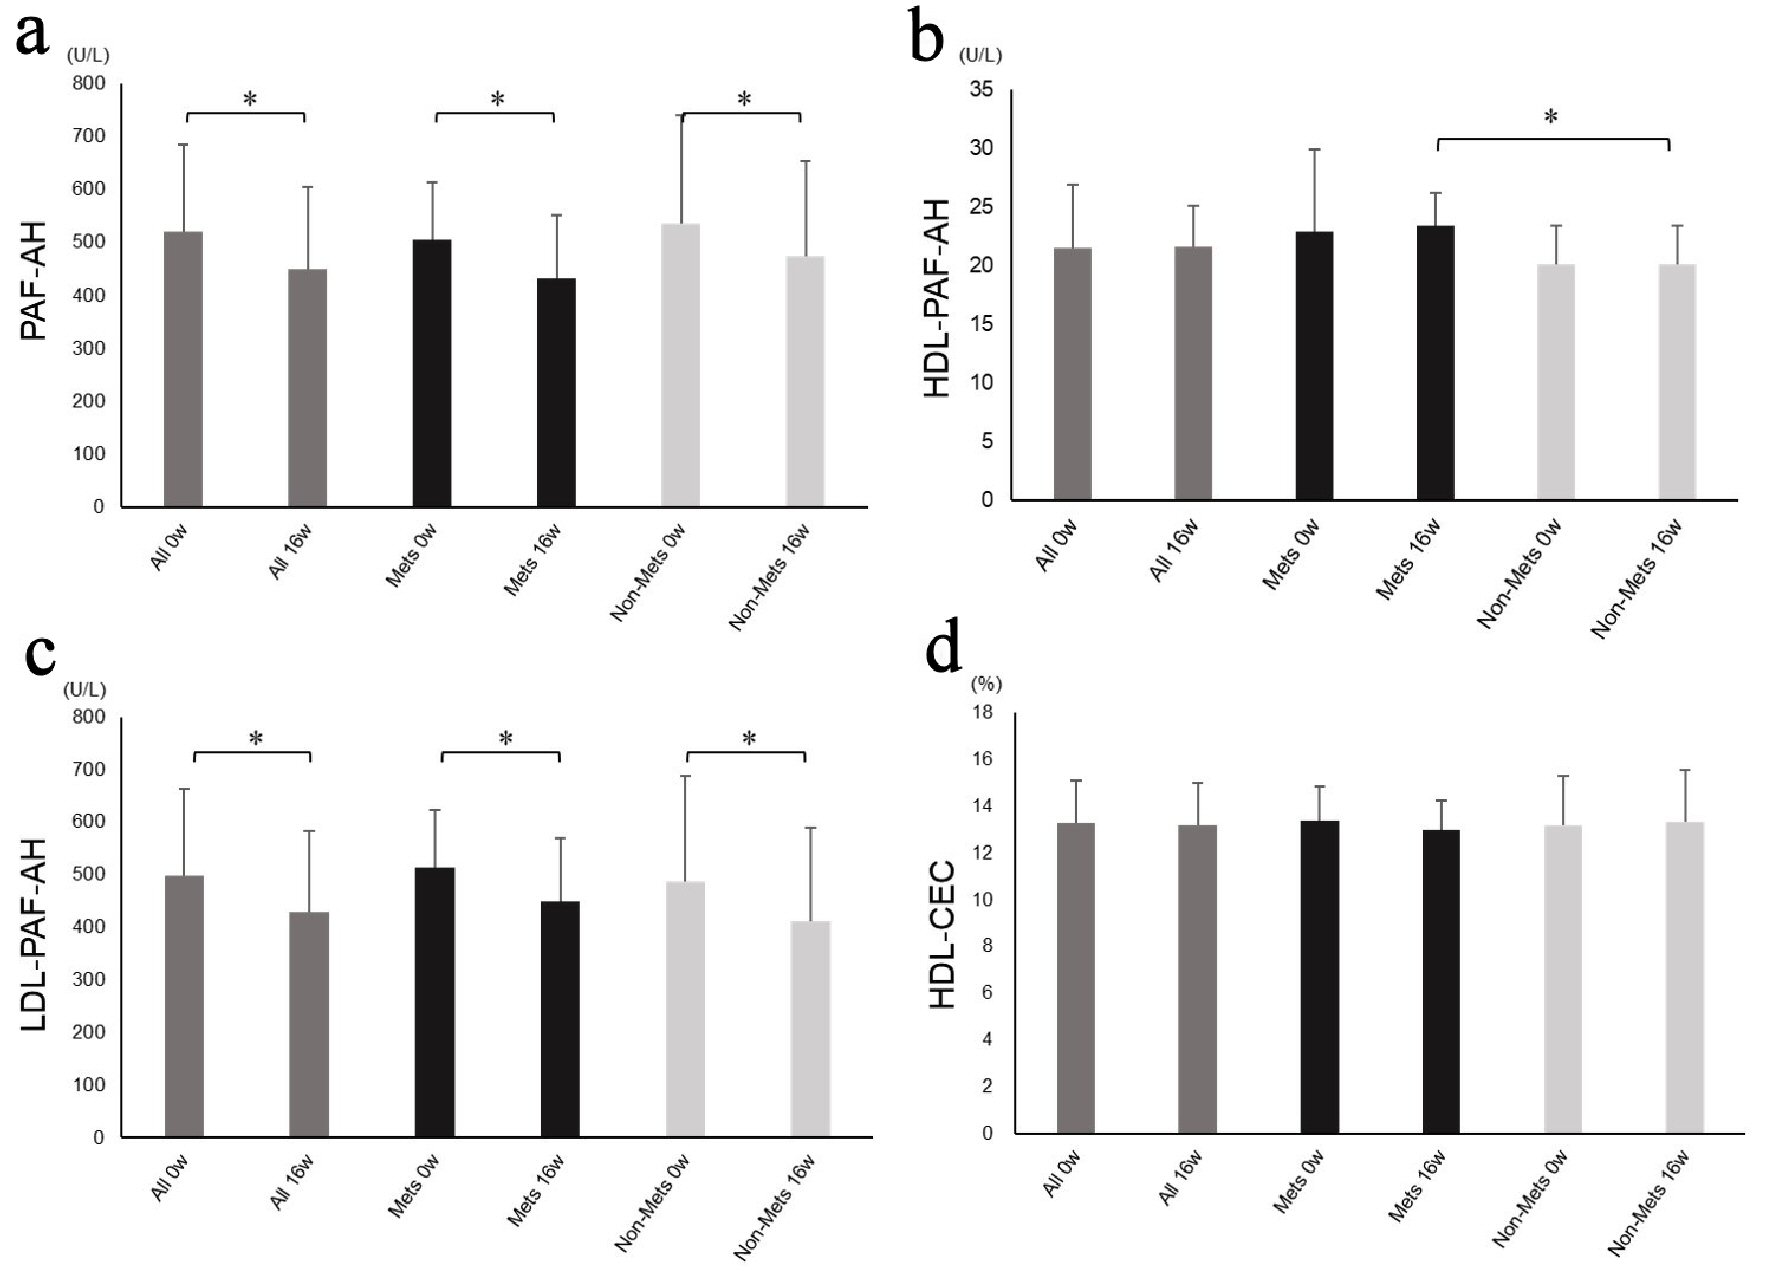
Figure 1. Platelet-activating factor acetylhydrolase activity and high-density lipoprotein cholesterol efflux capacity. PAF-AH (a), HDL-PAF-AH (b), LDL-PAF-AH activity (c) and HDL-CEC (d) at baseline and after 16 weeks of treatment in all patients and in the MetS and non-MetS groups. PAF-AH: platelet-activating factor acetylhydrolase; HDL-PAF-AH: high-density lipoprotein-associated PAF-AH; LDL-PAF-AH: low-density lipoprotein-associated PAF-AH; HDL-CEC: high-density lipoprotein cholesterol efflux capacity; MetS: metabolic syndrome. *P < 0.05.

Tables

Table 1. Patient Characteristics
 
All (n = 42)MetS (n = 22)Non-MetS (n = 20)P value (MetS vs. non-MetS)
MetS: metabolic syndrome; BMI: body mass index; HT: hypertension; DM: diabetes mellitus; CAD: coronary artery disease. P values showed comparison between MetS vs. non-MetS groups.
Age, years61.0 ± 8.861.1 ± 9.860.9 ± 7.81.0
Male, n (%)25 (59.5)16 (72.7)9 (45.0)0.07
BMI, kg/m226.3 ± 3.427.0 ± 3.325.4 ± 3.30.1
HT, n (%)36 (87.8)18 (81.8)18 (90.0)0.2
DM, n (%)24 (57.1)17 (77.3)7 (35.0)0.006
CAD, n (%)5 (11.9)3 (13.6)2 (10.0)0.7


Table 2. Laboratory Data on Pre- and Post-Treatment With Ezetimibe for 16 Weeks
 
ValuablesAll (n = 42)MetS (n = 22)Non-MetS (n = 20)P value (MetS vs. non-MetS)
MetS: metabolic syndrome; WBC: white blood cell; hs-CRP: high-sensitivity C-reactive protein; BUN: blood urea nitrogen; Cr: creatinine; AST: aspartate transaminase; ALT: alanine transaminase; T-chol: total cholesterol; TG: triglyceride; HDL-chol: high-density lipoprotein cholesterol; LDL-chol: low-density lipoprotein cholesterol; RLP-chol: remnant-like particles cholesterol. P values showed comparison between MetS vs. non-MetS groups. *P < 0.05 compared to same group between 0 week and 16 weeks.
0 week
  WBC, /µL5,552 ± 1,4945,705 ± 1,3834,850 (4,150 - 6,300)0.2
  hs-CRP, µg/dL741 (294 - 1,350)1,027 ± 882969 ± 9410.8
  BUN, mg/dL13.7 ± 3.313.8 ± 3.213.6 ± 3.50.8
  Cr, mg/dL0.78 (0.65 - 0.87)0.79 (0.71 - 0.87)0.74 (0.61 - 0.88)0.5
  AST, IU/L23 (19 - 28)23 (19 - 31)23 (20 - 24)0.5
  ALT, IU/L26 (18 - 38)28 (19 - 47)27.0 ± 14.50.3
  T-chol, mg/dL242 ± 33249 ± 35234 ± 290.2
  TG, mg/dL150 ± 68178 ± 61120 ± 640.004
  HDL-chol, mg/dL54.3 ± 12.652.6 ± 12.356.2 ± 13.10.4
  LDL-chol, mg/dL165 ± 29171 ± 30158 ± 260.1
  RLP-chol, mg/dL6.4 (4.4 - 7.8)7.4 (6.8 - 9.1)4.6 (3.7 - 5.5)0.0002
  Adiponectin, µg/mL4.3 (2.3 - 5.7)3.4 (2.0 - 5.6)4.7 (3.5 - 7.7)0.1
16 weeks
  WBC, /µL5,539 ± 1,3355,621 ± 1,0985,458 ± 1,5630.7
  hs-CRP, µg/dL588 (349 - 1,070)596 (296 - 1,200)543 (360 - 1,070)0.8
  BUN, mg/dL13.1 ± 3.312.8 ± 3.5*13.5 ± 3.10.5
  Cr, mg/dL0.76 (0.64 - 0.88)0.80 (0.70 - 0.93)0.73 (0.60 - 0.86)0.2
  AST, IU/L22 (18 - 28)23 (19 - 36)22 (18 - 25)0.5
  ALT, IU/L24 (18 - 43)29 (18 - 53)24 (17 - 37)0.2
  T-chol, mg/dL208 (191 - 223)*213 ± 39*210 ± 21*0.7
  TG, mg/dL127 (113 - 144)166 ± 51118 (96 - 129)0.01
  HDL-chol, mg/dL56.5 ± 13.554.9 ± 15.858.1 ± 10.90.5
  LDL-chol, mg/dL127 (113 - 144)*134 ± 31*132 ± 24*0.8
  RLP-chol, mg/dL4.8 (4.0 - 6.9)*6.5 ± 2.5*4.5 ± 1.40.01
  Adiponectin, µg/mL4.6 (2.1 - 6.4)2.6 (1.9 - 6.0)4.9 (3.4 - 6.7)0.2