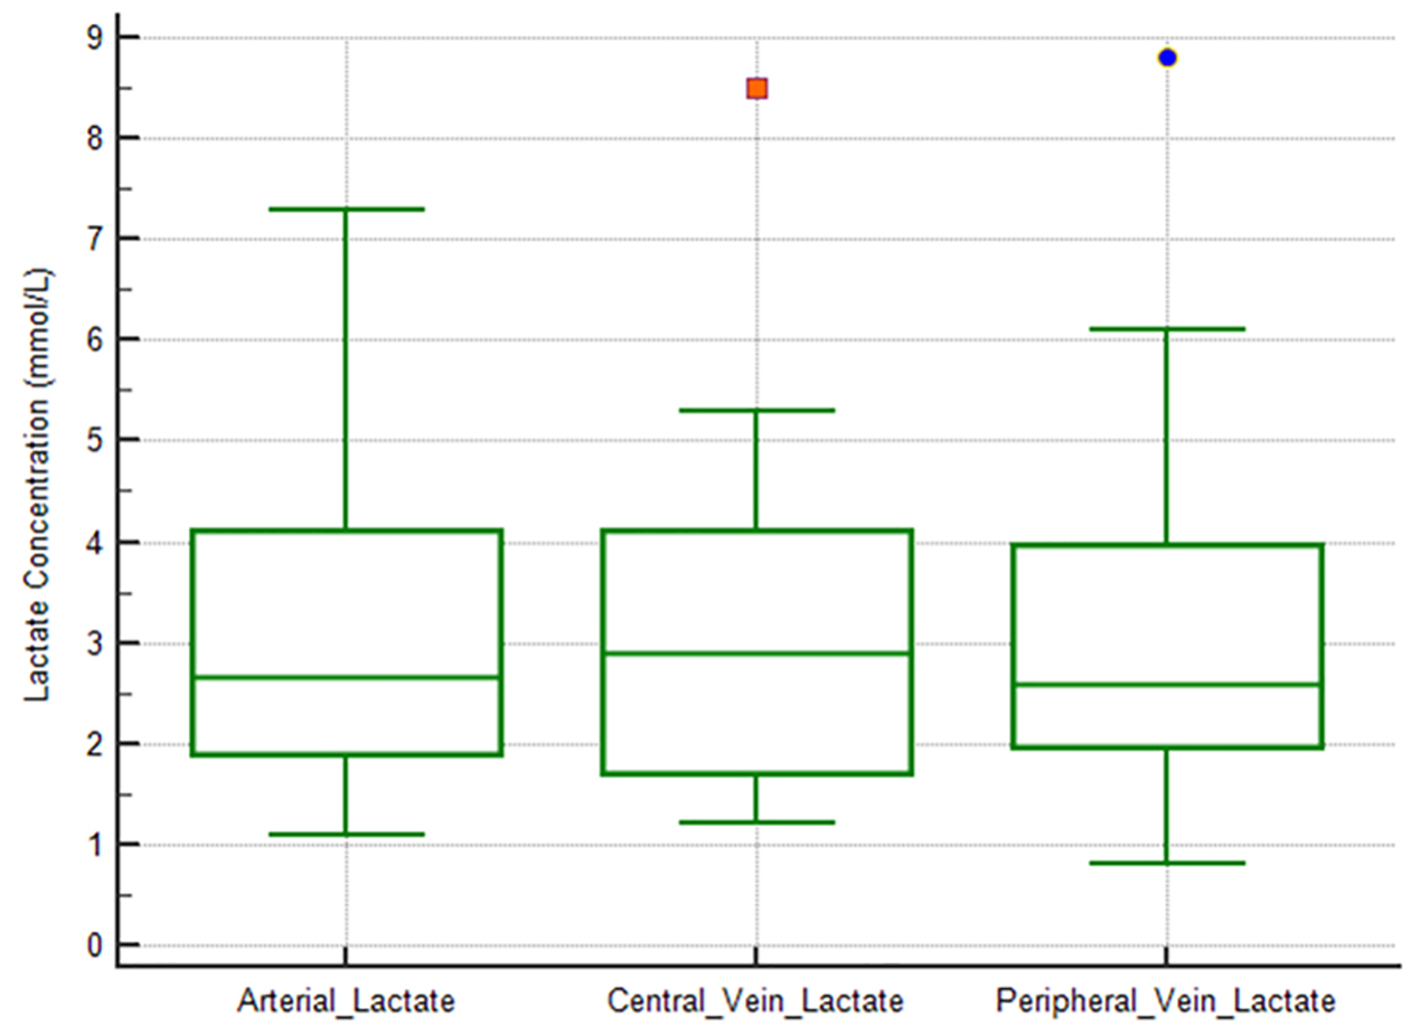
Figure 1. Box-plot diagrams comparing arterial versus central vein versus peripheral vein lactate levels. There are no significant differences between the three sample sites.
| Journal of Clinical Medicine Research, ISSN 1918-3003 print, 1918-3011 online, Open Access |
| Article copyright, the authors; Journal compilation copyright, J Clin Med Res and Elmer Press Inc |
| Journal website http://www.jocmr.org |
Original Article
Volume 11, Number 9, September 2019, pages 629-634
Relation Between Central Venous, Peripheral Venous and Arterial Lactate Levels in Patients With Sepsis in the Emergency Department
Figures
Table
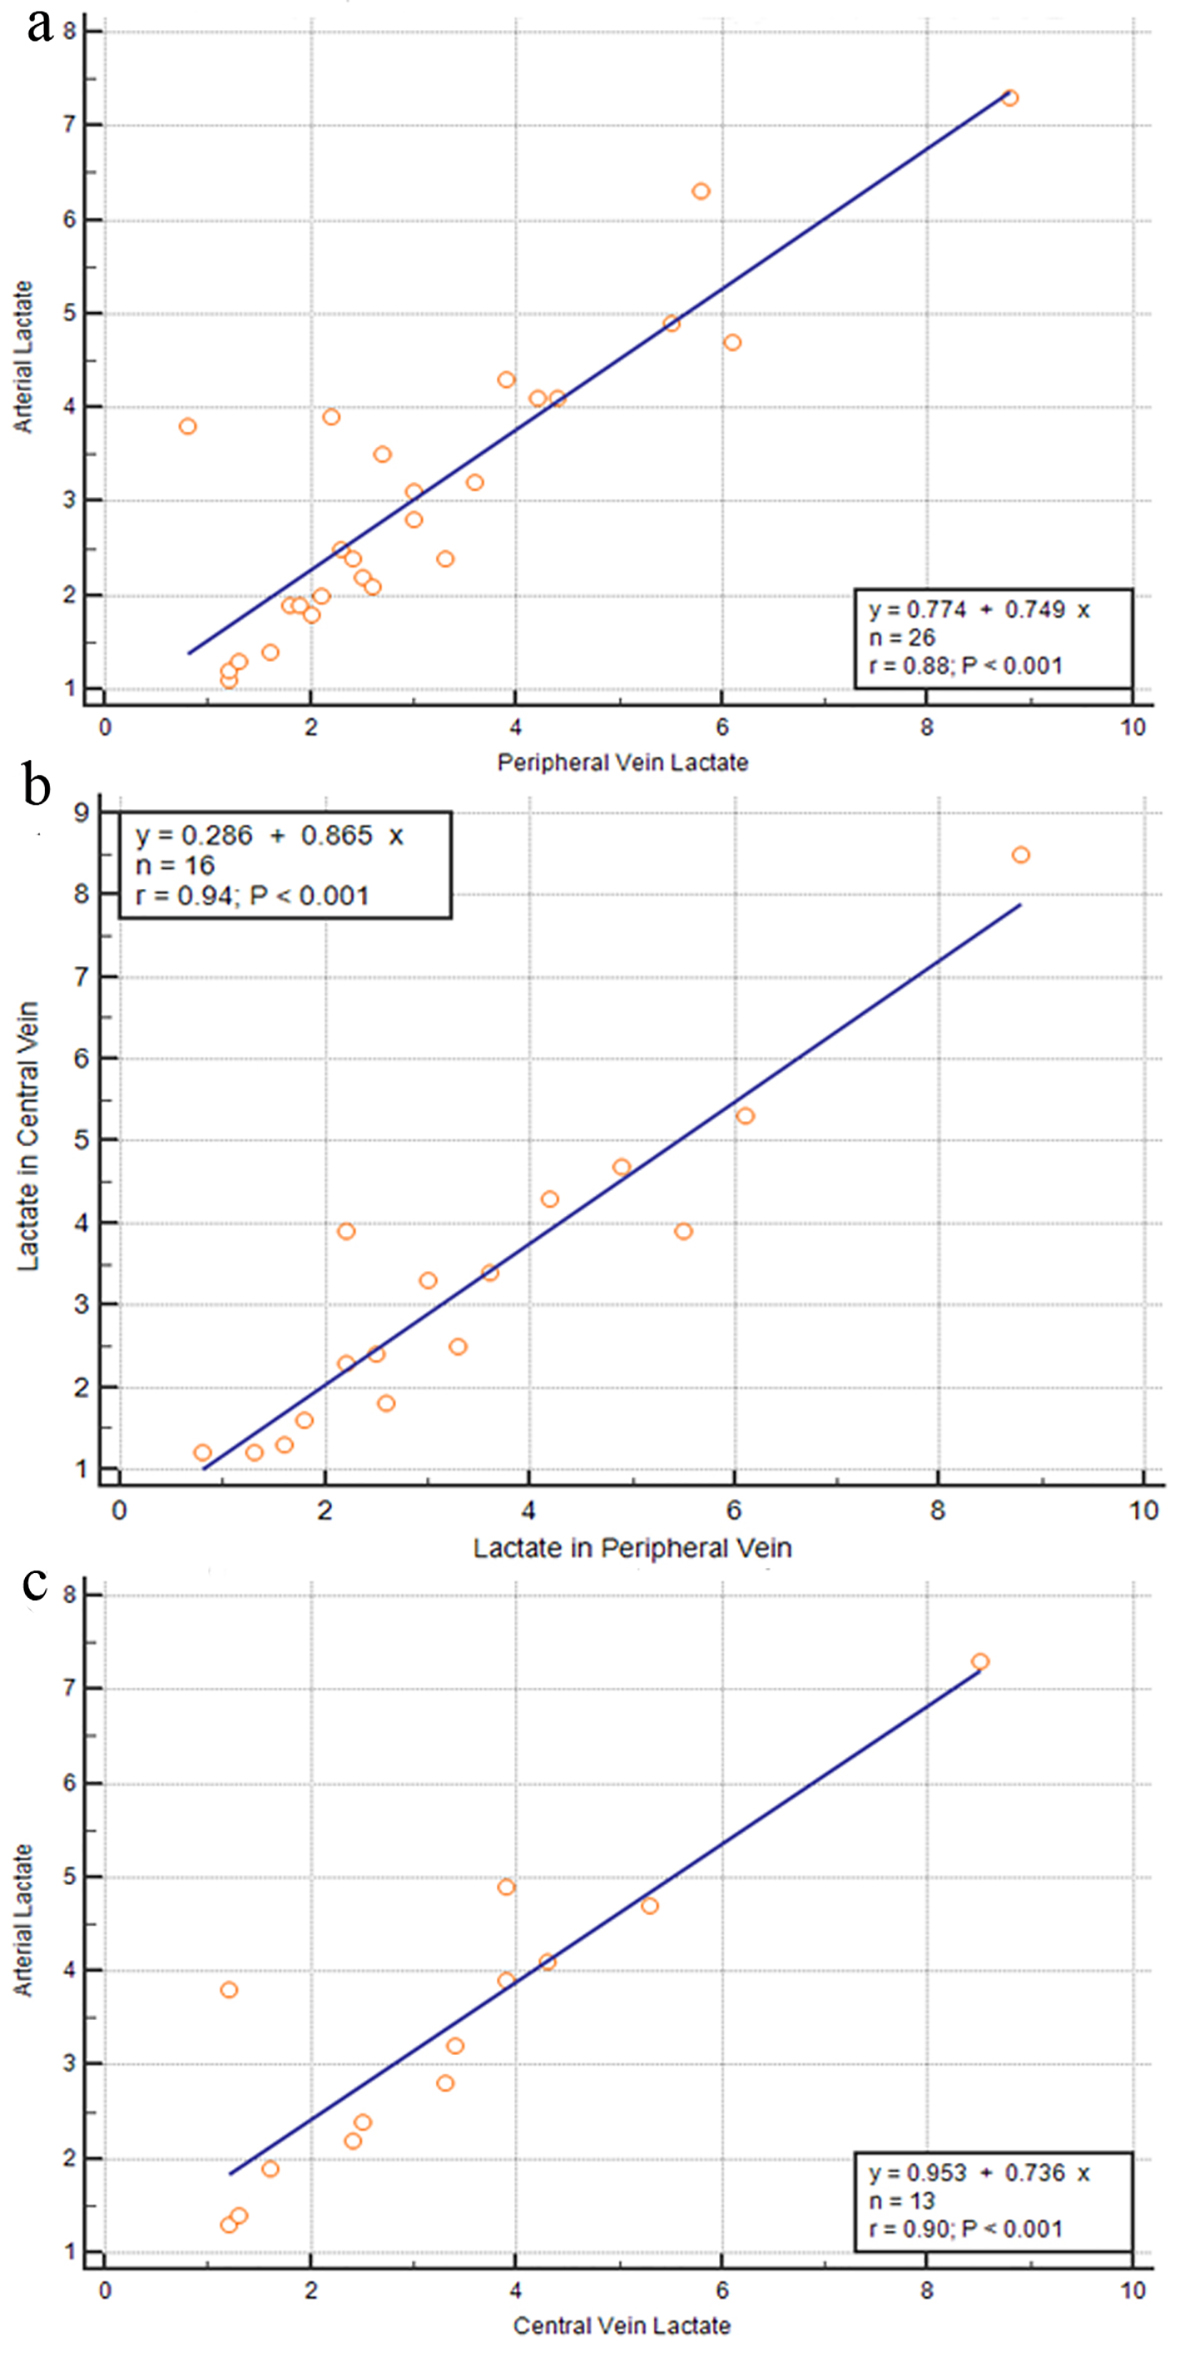
| Sites of lactate measurement | Arterial | Peripheral vein | Central vein |
|---|---|---|---|
| Arterial | |||
| Pearson correlation coefficient | 0.880 | 0.898 | |
| Significance level P | < 0.0001 | < 0.0001 | |
| n | 26 | 13 | |
| Peripheral vein | |||
| Pearson correlation coefficient | 0.880 | 0.941 | |
| Significance level P | < 0.0001 | < 0.0001 | |
| n | 26 | 16 | |
| Central vein | |||
| Pearson correlation coefficient | 0.898 | 0.941 | |
| Significance level P | < 0.0001 | < 0.0001 | |
| n | 13 | 16 | |