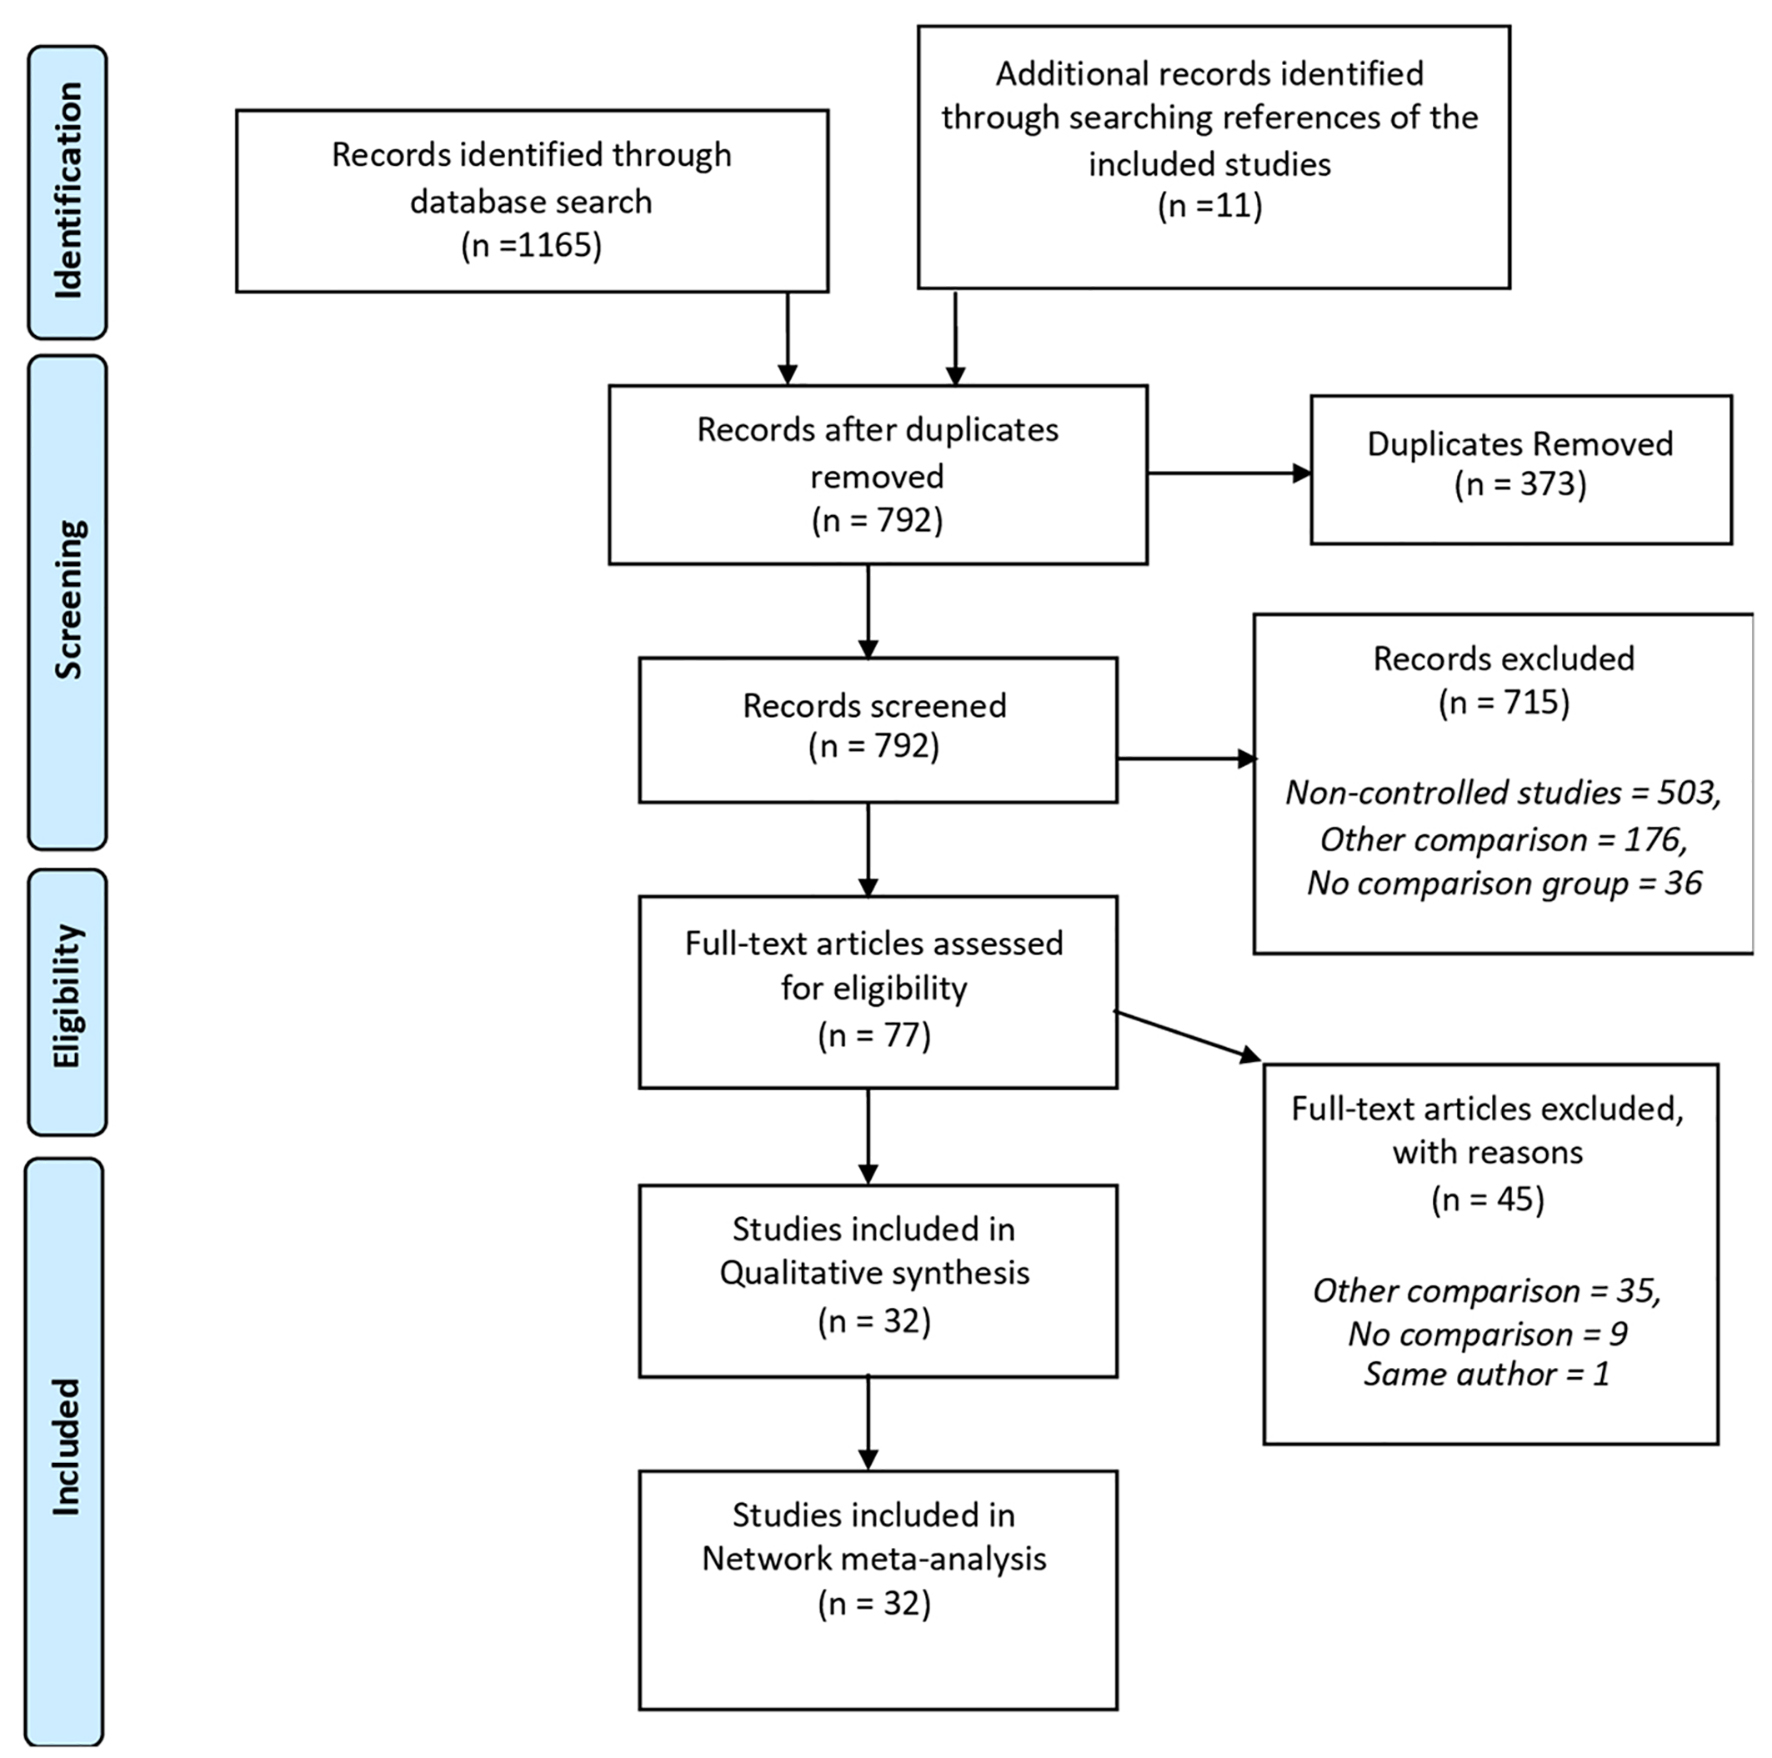
Figure 1. Flow diagram of the search strategy and selection of studies.
| Journal of Clinical Medicine Research, ISSN 1918-3003 print, 1918-3011 online, Open Access |
| Article copyright, the authors; Journal compilation copyright, J Clin Med Res and Elmer Press Inc |
| Journal website http://www.jocmr.org |
Original Article
Volume 11, Number 8, August 2019, pages 572-582
Simultaneous, Delayed and Liver-First Hepatic Resections for Synchronous Colorectal Liver Metastases: A Systematic Review and Network Meta-Analysis
Figures
Table
| Author, year, study design, period, country | Number of patients (S/D/LF) | Gender (M), n (%) (S/D/LF) | Age (S/D/LF) | Colonic primaries (S/D/LF) | Major liver resection (S/D/LF) | NOS (max.: 9) |
|---|---|---|---|---|---|---|
| S: simultaneous; D: delayed; LF: liver-first; ns: non-significant; NR: not reported; NOS: Newcastle-Ottawa scale; RS: retrospective study. | ||||||
| Fukami et al [46], 2016, RS, 2006 - 2013, Japan | 41/22/0 | 18 (44) 12 (55) P = 0.442 | 65 ± 9 65 ± 7 P = 0.755 | 25 (61) 10 (46) P = 0.291 | 9 (22) 7 (32) P = 0.091 | 8 |
| Silberhumer et al [45], 2016, RS, 1984 - 2008, USA | 320/109/0 | 176 (53) 68 (62) P = 0.10 | 59 ± 13 59 ± 12 P = 0.601 | 177 (55) 56 (51) P = 0.383 | 107 (33) 79 (73) P = 0.01 | 8 |
| Tanaka et al [48], 2015, Japan | 0/30/10 | 8 (27) 5 (50) P = 0.246 | 61 (37 - 80) 63 (39 - 74) P = 0.696 | 22 (73) 8 (80) P = 0.001 | 18 (61) 7 (70) P = 0.527 | 8 |
| She et al [44], 2014, RS, 1990 - 2008, Hong Kong, China | 28/88/0 | 22 (79) 59 (67) P = 0.25 | 65 (29 - 75) 59 (24 - 81) P = 0.06 | 15 (54) 69 (78) P = 0.01 | 12 (43) 54 (61) P = 0.09 | 8 |
| Andres et al [47], 2012, Multicenter International | 0/729/58 | 440 (60) 41 (71) P = 0.109 | 60 ± 11 59 ± 11 P = 0.710 | 558 (77) 25 (43) P < 0.001 | NR | 8 |
| Patrono et al [43], 2014, RS, 1997 - 2012, Italy | 46/60/0 | 24 (52) 37 (61) P = 0.33 | 64 ± 11 61 ± 9 P = 0.201 | 38 (83) 47 (78) P = 0.633 | 22 (48) 42 (70) P = 0.03 | 6 |
| Abbott et al [42], 2012, RS, 1993 -2010, USA | 60/84/0 | 40 (61) 49 (58) P = ns | 57 (45 - 64) 54 (46 - 68) P = 0.163 | 26 (43) 31 (37) P = 0.441 | 20 (33) 63 (75) P = 0.001 | 7 |
| Mayo et al [41], 2012, RS, 1982 - 2011, Multicenter International | 329/647/28 | 185 (56) 396 (68) 17 (60) P = ns | 60 ± 30 61 ± 18 58 ± 12 P > 0.05 | 238 (72) 475 (74) 13 (46) P = 0.007 | 78 (24) 250 (39) 10 (36) P < 0.001 | 8 |
| Brouquet et al [40], 2010, RS, 1992 - 2009, USA | 43/72/27 | 23 (53) 44 (61) 10 (37) P = ns | 58 (31 - 77) 56 (25 - 81) 48 (25 - 78) P = 0.02 | 25 (58) 37 (51) 19 (70) P = 0.02 | 15 (35) 48 (66) 24 (89) | 8 |
| de Haas et al [39], 2010, RS, 1990 - 2006, France | 55/173/0 | 28 (51) 107 (62) P = 0.914 | 56 58 P = 0.323 | 47 (85) 110 (64) P = 0.267 | NR | 8 |
| Luo et al [38], 2010, RS, 1994 - 2008, China | 129/276/0 | 76 (59) 156 (57) P = 0.650 | 58 60 P = 0.720 | 60 (47) 138 (50) P = 0.470 | 44 (34) 133 (48) P = 0.054 | 7 |
| Kaibori et al [37], 2010, RS, 1993 - 2007, Japan | 32/42/0 | 27 (53) 27 (64) P = 0.332 | 65 62 P = 0.233 | 17 (53) 9 (21) P = 0.084 | 10 (32) 9 (38) P = 0.90 | 9 |
| Moug et al [36], 2010, RS, UK | 32/32/0 | 18 (56) 21 (66) P = ns | 69 67 P ≥ 0.05 | 17 (53) 17 (53) P = ns | 7 (22) 7 (22) P = ns | 8 |
| Van der Pool et al [35], 2010, RS, 2000 - 2007, The Netherlands | 8/29/20 | NR | NR | All rectal | NR | 6 |
| Slupski et al [34], 2009, RS, 1997 - 2006, Poland | 28/61/0 | 18 (64) 34 (56) P = 0.48 | 59 60 P = 0.710 | NR | 8 (28) 29 (48) P = 0.10 | 7 |
| Martin et al [33], 2009, RS, 1997 - 2008, USA | 70/160/0 | 38 (54) 83 (52) P = 0.7 | 58 61 P = 0.06 | 49 (70) 123 (77) P = ns | 33 (47) 64 (40) P = ns | 7 |
| Petri et al [32], 2008, RS, 1999 - 2008, Hungary | 14/29/0 | 8 (57) 17 (59) P = nr | 60 64 P = nr | NR | 0% 6 (29) P = 0.155 | 6 |
| Yoshidome et al [31], 2008, RS, 1985 - 2006, Japan | 116/21/0 | 71 (58) 12 (52) P = 0.914 | NR | 67 (58) 11 (52) P = 0.820 | NR | 6 |
| Reddy et al [30], 2007, RS, 1985 - 2005, USA | 135/474/0 | 84 (62) 275 (58) P = 0.47 | 57 58 P = 0.641 | 81 (60) 365 (77) P = 0.001 | 36 (27) 291 (61) P = 0.001 | 6 |
| Thelen et al [29], 2007, RS, 1988 - 2005, Germany | 40/179/0 | 24 (60) 96 (54) P = 0.465 | 60 60 P = 0.731 | 34 (85) 107 (60) P = 0.04 | 15 (38) 141 (79) P = 0.001 | 7 |
| Yan et al [28], 2007, OCS, Australia | 73/30/0 | 48 (47) 37 (45) P = 0.671 | 60 59 P = 0.821 | 58 (79) 18 (60) P = 0.05 | 54 (74) 22 (73) P = ns | 8 |
| Capussotti et al [27], 2007, RS, 1984 - 2004, Italy | 70/57/0 | 40 (54) 35 (59) P = 0.710 | 65 60 P = 0.10 | 43 (61) 37 (65) P = 0.713 | 24 (34) 32 (56) P = 0.01 | 8 |
| Turini et al [26], 2007, RS, 1996 - 2004, France | 57/62/0 | NR | 60 59 P = 0.08 | 33 (58) 42 (68) P = 0.07 | 7 (25) 23 (29) P = ns | 6 |
| Vassiliou et al [25], 2007, RS, 1996 - 2004, Greece | 25/78/0 | 15 (59) 47 (61) P = ns | 63 61 P = ns | 22 (88) 70 (89) P = ns | NR | 8 |
| Taniai et al [24], 2006, RS, 1990 - 2002, Japan | 67/41/0 | 35 (52) 25 (61) P = 0.375 | 63 63 P = 0.628 | 25 (37) 14 (34) P = 0.733 | NR | 6 |
| Minagawa et al [23], 2006, RS, 1980 - 2002, Japan | 142/18/0 | NR | NR | 70 (49) 14 (78) P = 0.02 | 16 (11) 7 (38) P = 0.005 | 5 |
| Chua et al [22], 2004, RS, 1996 - 1999, USA | 64/32/0 | 39 (61) 18 (56) P = 0.7 | 63 61 P = 0.34 | 29 (46) 17 (54) P = 0.520 | 10 (16) 13 (40) P = 0.01 | 9 |
| Tanaka et al [21], 2004, Japan | 39/37/0 | 20 (51) 25 (68) P = ns | NR | 25 (65) 20 (53) | 5 (13) 22 (59) P < 0.01 | 7 |
| Weber et al [20], 2000, RS, 1987 - 2000, France | 35/62/0 | 18 (51) 31 (50) P = 0.89 | 58 60 P = 0.54 | 25 (71) 38 (61) P = 0.431 | 11 (31) 35 (56) P = 0.01 | 5 |
| Jaeck et al [19], 1999, RS, France | 28/31/0 | NR | 56 60 P = 0.70 | 22 (78) 19 (61) P = 0.170 | 11 (32) 17 (52) P = 0.11 | 7 |
| Vogt et al [18], 1991, RS, 1977 - 1987, Germany | 19/17/0 | NR | NR | NR | 6 (32) 9 (53) P = 0.521 | 5 |
| Scheele et al [17], 1991, RS, 1960 - 1988, Germany | 90/42/0 | NR | NR | NR | NR | 6 |
| Pooled total, 6,202 | 2,235/3,824/143 | P = ns | P = ns | 61% 66% 59% P = 1.00 | 565 (30) 1,415 (53) 41 (29) P < 0.001 | Higher quality 22 |