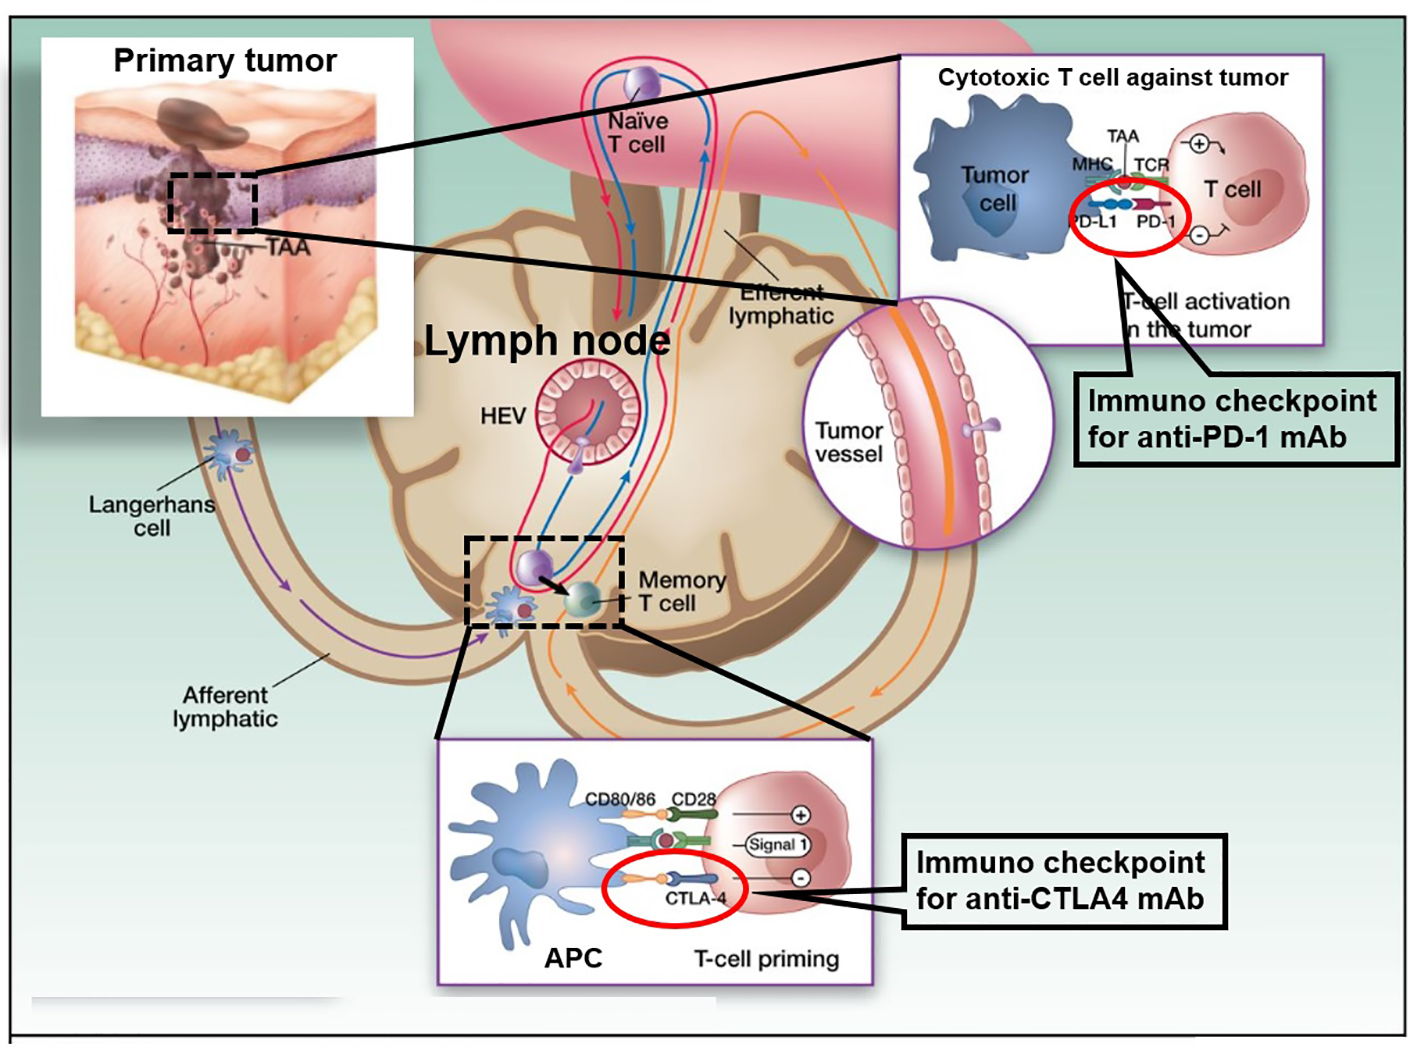
Figure 1. Cancer therapy by inhibition of negative immune regulation by programmed death 1 (PD-1) and cytotoxic T-lymphocyte-associated protein 4 (CTLA-4). The figure shows a primary melanoma and tumor-associated antigens (TAAs) that are taken up by an antigen presenting cell (APC: a Langerhans cell; left). APCs then migrate via afferent lymphatics to the sentinel skin-draining lymph node, where they present TAA to naive T cells. These naive T cells continuously screen the lymphoid organs, extravasating through high endothelial venule (HEV) until their corresponding peptide is presented to them in the context of the major histocompatibility complex (MHC). When a TAA is presented in the T-cell-dependent area of a lymph node to its specific naive T cell (center), the latter requires signal 1 (antigen presentation to the T-cell receptor) and 2 (costimulation) for full activation. It will then proliferate and acquire “antigen memory” and a distinct and different set of adhesion molecules that will allow it to navigate outside of the blood vessels and the lymphoid organs, to the peripheral tissues and organs, like the melanoma metastases where it will be able to be reactivated upon re-presentation of the same TAA. However, in the lymph node, T-cell activation is interrupted when signal 3, mediated through interaction between CTLA-4 and CD80/86, takes over CD28 and CD80/86 interaction. This occurs 24 - 48 h after the initiation of T-cell priming. When the memory T cell is recruited to the melanoma metastasis (right) and activated upon TAA re-presentation, the effector activation is decreased when PD-1 is engaged with its ligand PD-L1 that can be expressed on the tumor cell constitutively or in the context of inflammation. The figure adapted from the C. Robert and C. Verjat figure collection, Institute Gustave Roussy (Villejuif-Paris Sud, Paris, France) is modified.