Journal of Clinical Medicine Research, ISSN 1918-3003 print, 1918-3011 online, Open Access
Article copyright, the authors; Journal compilation copyright, J Clin Med Res and Elmer Press Inc
Journal website http://www.jocmr.org

Original Article

Volume 11, Number 7, July 2019, pages 489-494


Postoperative Pain Perception and Patient’s Satisfaction After Mandibular Third Molar Surgery by Primary Closure With Distal Wedge Surgery

Figures

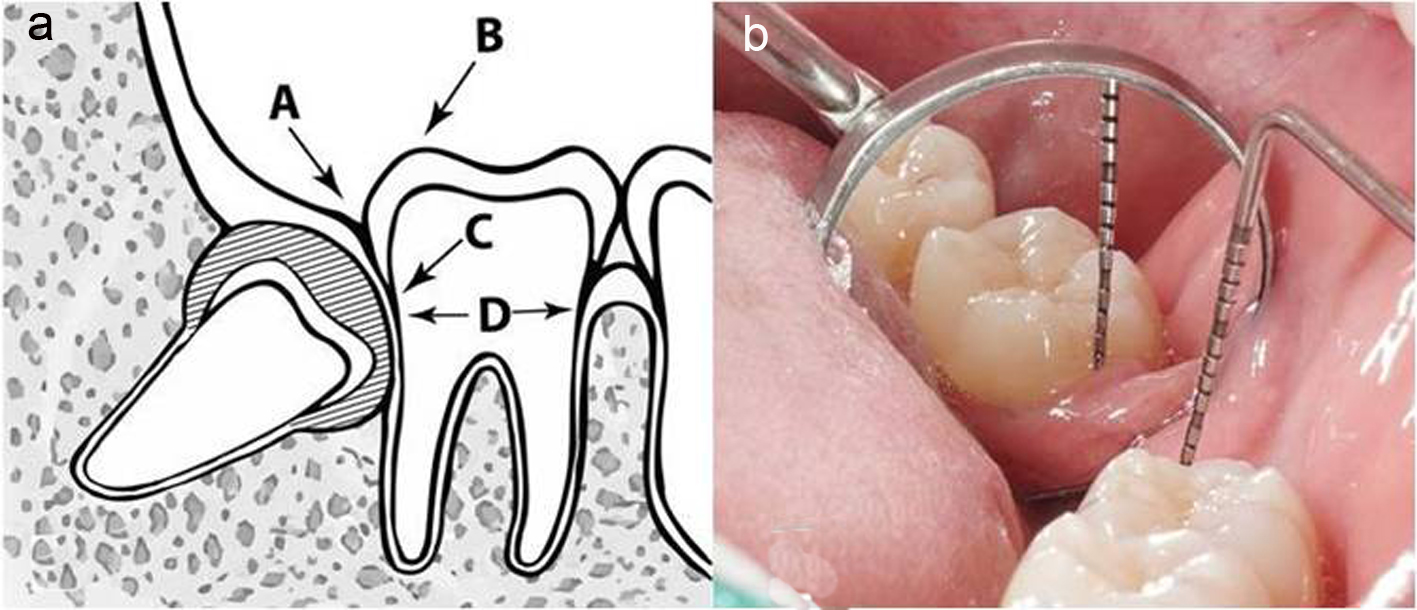
Figure 1.
Figure 1. (a) Drawing picture of landmarks used for clinical measurements; gingival margin (A), cusp tip of mandibular second molar (B), cemento-enamel junction (C) and bottom of gingival pocket (D). (b) Intraoral photograph for the measurement of the distance from cusp tip to gingival margin using UNC15 probe.
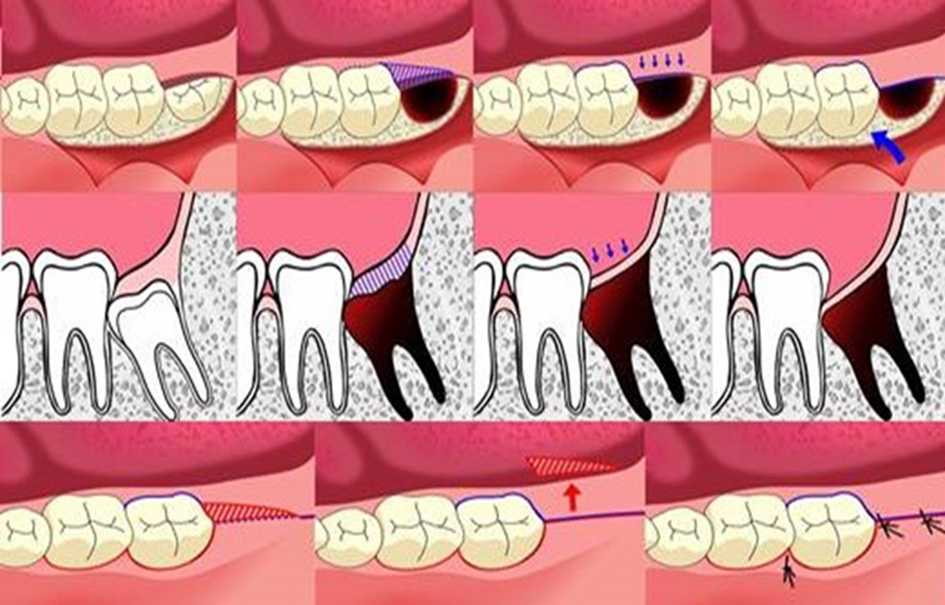
Figure 2.
Figure 2. The study site undergoing surgical technique combined with distal wedge operation.

Tables

Table 1. Patient’s Inclusion and Exclusion Criteria Including Withdrawal Criteria
 
Inclusion criteriaExclusion criteriaWithdrawal criteria
Age between 18 - 25 years; having good systemic health; no smoking; having symmetrically positioned MTMI on both sides; not allergic to 4% articaine with 1:100,000 adrenaline; understanding and carrying out the instructions given by the investigators; having given written informed consent for the studyPregnant or lactating mother; having serious medical conditions such as hypertension; cardiovascular problems, renal and/or liver failure, or smoking habit; inability to attend the periodic examinations; taking any medication during the previous 5 days prior to the surgery that would alter their pain perception (e.g. analgesics, antidepressants)Patients could leave the study at any time depending on their own decisions and will


Table 2. Distribution of Class, Position and Angulation of MTMI
 
ClassificationPosition BPosition CTotal
VerticalMesioangularHorizontalVerticalMesioangularHorizontal
Class I6 (13.6%)12 (27.3%)4 (9.1%)010 (22.7%)032 (72.7%)
Class II02 (4.55%)008 (18.2%)2 (4.55%)12 (27.3%)
Total6 (13.6%)14 (31.85%)4 (9.1%)018 (40.9%)2 (4.55%)44 (100%)


Table 3. The Mean Difference (Mean ± SD, mm) of CT-GM Between Baseline and the Third Month, the Mean CEJ-GM and PD at the Third Month
 
GroupDisto-buccalMid-distalDisto-lingual
*P < 0.05, **P < 0.01 and ***P < 0.001. CT-GM: from cusp tip to gingival margin; CEJ-GM: from cemento-enamel junction to gingival margin; PD: probing depth.
CT-GM between baseline and the third month
  Control1.27 ± 1.120.82 ± 0.790.72 ± 0.94
  Study2.0 ± 0.982.95 ± 1.171.77 ± 0.75
  P value0.002**0.000***0.001***
CEJ-GM at the third month
  Control-0.91 ± 1.36-2.45 ± 1.37-1.68 ± 1.17
  Study-0.18 ± 0.50-1.27 ± 0.98-0.73 ± 0.88
  P value0.02*0.004**0.000***
PD at the third month
  Control3.00 ± 0.873.50 ± 0.673.00 ± 0.62
  Study2.59 ± 0.593.09 ± 0.532.91 ± 0.68
  P value0.029*0.013*0.589


Table 4. The Mean VAS Score at the Seventh Day and Third Month (Mean ± SD)
 
SymptomsThe seventh day (VAS)The third month (VAS)
Pain
  Control1.35 ± 1.520
  Study1.76 ± 1.560
  P value0.1471.000
Swelling
  Control1.11 ± 1.370.01 ± 0.04
  Study1.17 ± 1.140
  P value0.1950.317
Bleeding
  Control0.60 ± 0.710.01 ± 0.02
  Study1.20 ± 1.740
  P value0.730.317
Food impaction
  Control2.24 ± 3.010.14 ± 0.06
  Study2.73 ± 3.110
  P value0.6430.317
Trismus
  Control1.14 ± 1.570.01 ± 0.04
  Study1.38 ± 1.720.01 ± 0.04
  P value0.1951.000
Irritation
  Control1.76 ± 2.640.05 ± 0.22
  Study2.20 ± 2.500.01 ± 0.04
  P value0.2950.317
Overall symptom
  Control1.52 ± 1.620.01 ± 0.02
  Study1.52 ± 1.730.01 ± 0.02
  P value0.2951.000
Eating
  Control1.98 ± 2.090.01 ± 0.02
  Study1.90 ± 2.210.02 ± 0.11
  P value0.6580.317
Chewing
  Control1.78 ± 1.790.01 ± 0.04
  Study1.67 ± 1.860
  P value0.5540.317
Talking
  Control1.09 ± 1.230.01 ± 0.06
  Study0.93 ± 1.080.01 ± 0.06
  P value0.6151.000
Smiling or laughing
  Control1.19 ± 1.630.01 ± 0.02
  Study1.16 ± 1.820.01 ± 0.04
  P value0.7760.317
Daily activities
  Control0.83 ± 1.290.01 ± 0.02
  Study1.19 ± 1.810.01 ± 0.04
  P value0.3480.317