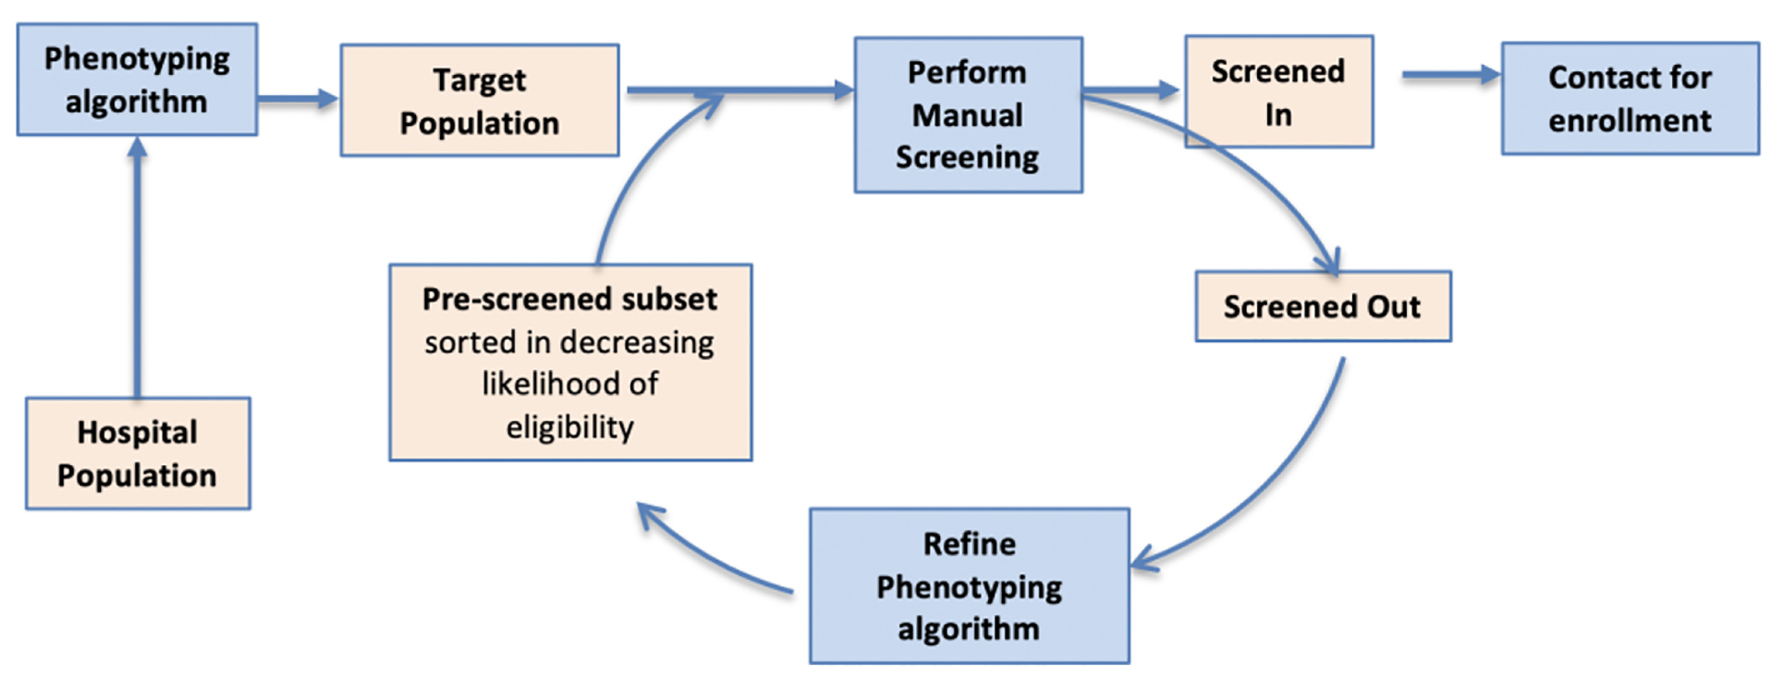
Figure 1. DP consists of multiple screen cycles. At the start of each cycle, phenotyping is used to identify eligible patients from the EHR, creating an ordered list in which the most eligible patients are listed first. This list is manually screened, and the results are analyzed to improve phenotyping for the next cycle. DP: dynamic phenotyping; EHR: electronic health record.
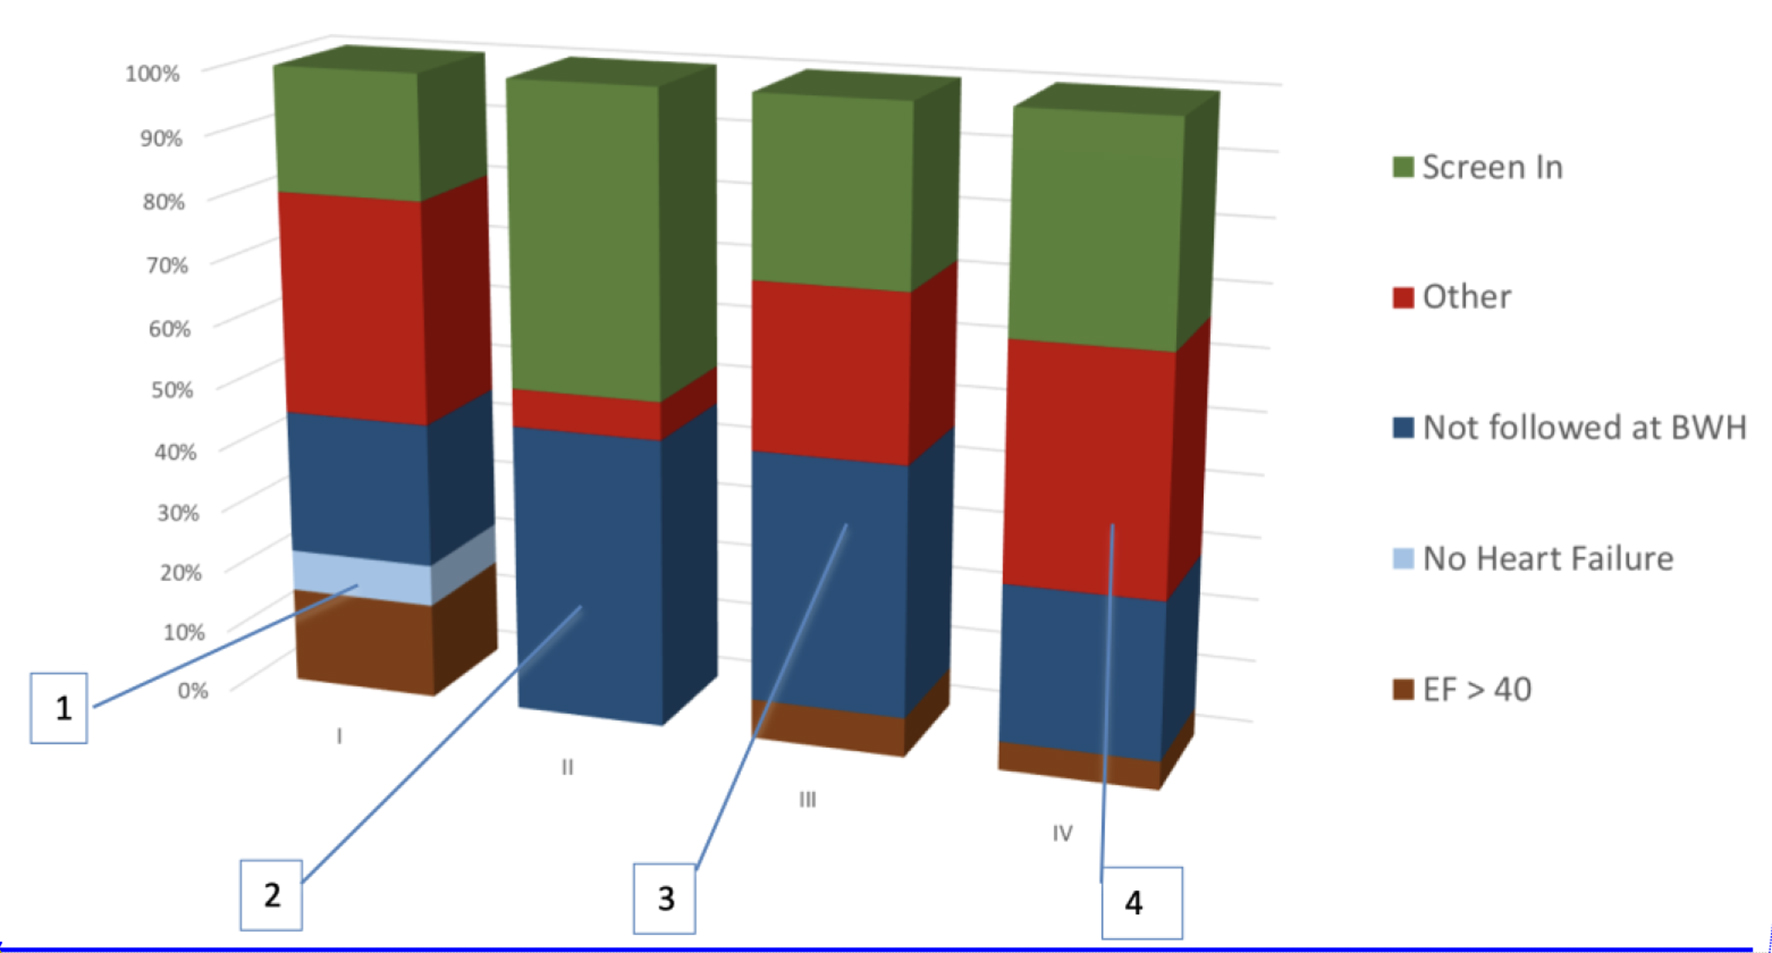
Figure 2. Composition of manual screening performed in each cycle. 1) No HF and EF accounted for 25% of false positives. HF was detected by machine learning and EF was extracted using a simple regular expression from clinical notes. 2) Optimization of EF parser and inferring HF from low EF eliminated many false positives. But failure to exclude patients not primarily managed by the outpatient cardiology clinic at BWH emerged as a challenge. This was because the cardiologist was inferred using total number of EHRs entries authored for the patient. 3) Cardiologist was inferred from number of EHR entries limited to the outpatient setting. But this did not significantly reduce false positives. 4) Use of machine learning to infer the primary cardiologist significantly excluded patients that are not managed at BWH. HF: heart failure; EF: ejection fraction; BWH: Brigham and Women’s Hospital; EHR: electronic health record.