Journal of Clinical Medicine Research, ISSN 1918-3003 print, 1918-3011 online, Open Access
Article copyright, the authors; Journal compilation copyright, J Clin Med Res and Elmer Press Inc
Journal website http://www.jocmr.org

Original Article

Volume 11, Number 5, May 2019, pages 367-374


Association of Age and Anemia With Adiponectin Serum Levels in Normal-Weight Japanese Women

Figures

Figure 1.
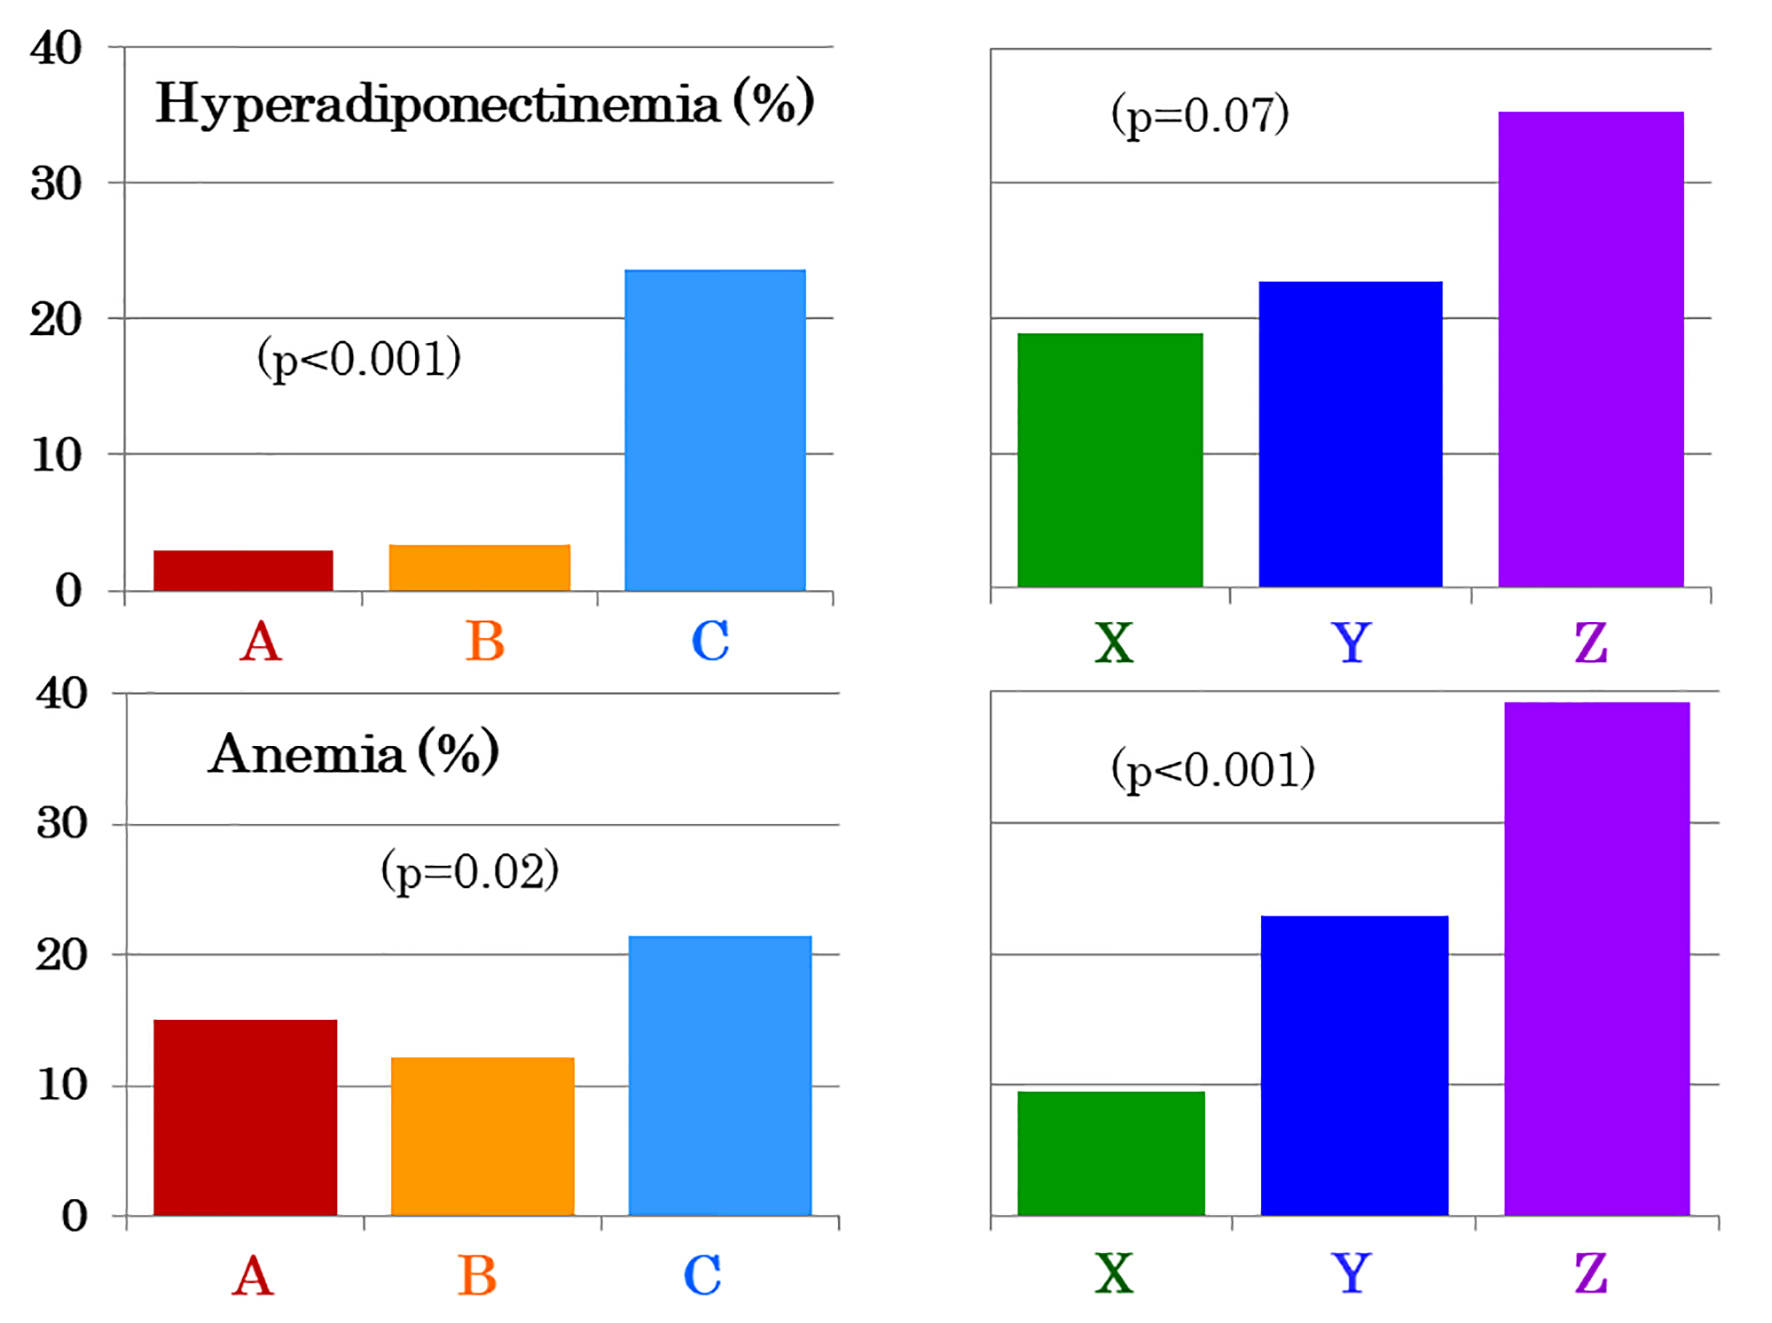
Figure 1. The prevalence of hyperadiponectinemia (upper panel) and anemia (lower panel) in 311 young (A, red bars), 148 middle-aged (B, yellow bars) and 322 elderly women (C, light blue bars). Elderly women were subdivided into three age groups: between 65 and 74 years (n = 95, X, green bars), between 75 and 84 years (n = 176, Y, dark blue bars) and between 85 and 96 years (n = 51, Z, purple bars).
Figure 2.
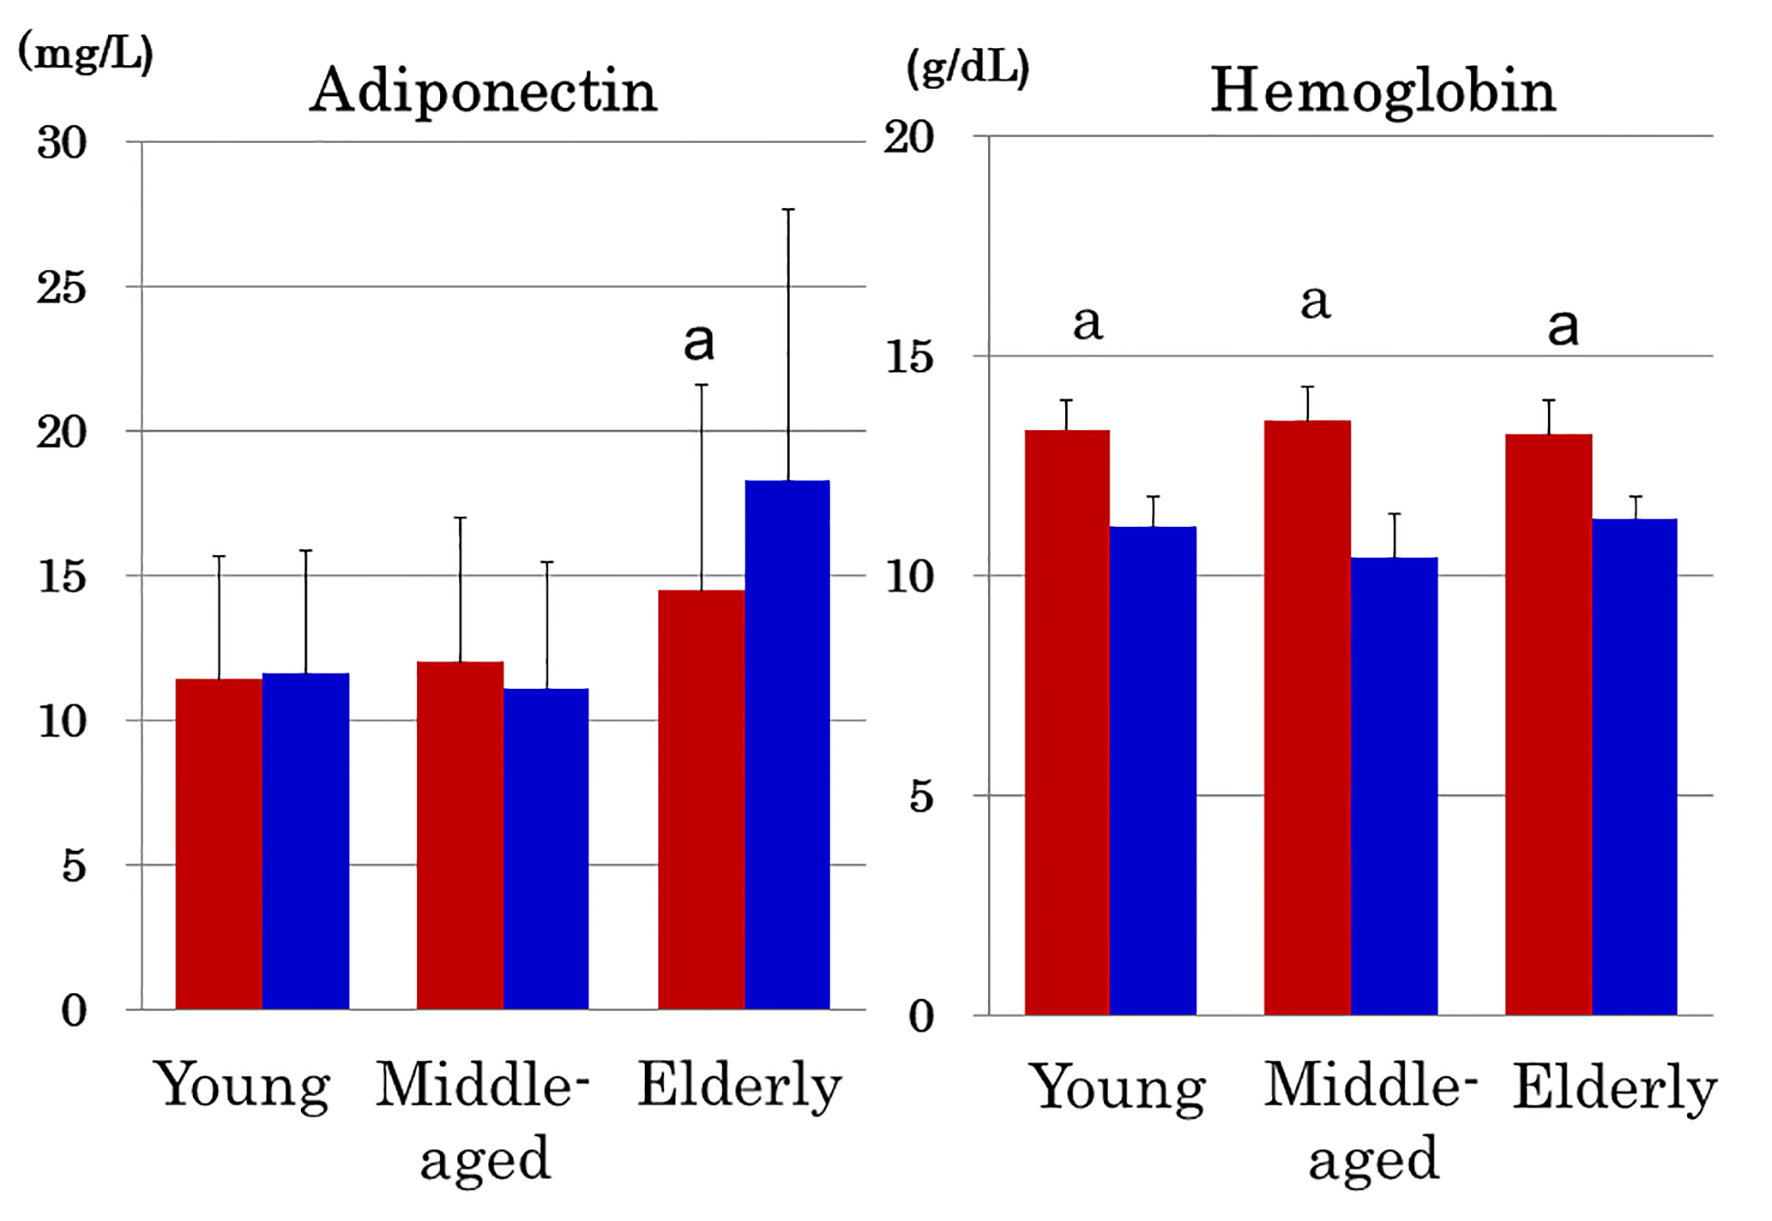
Figure 2. Serum adiponectin and hemoglobin in young, middle-aged and elderly women in the absence (red columns) and presence of anemia (blue columns). Note that adiponectin was elevated in anemic elderly women but not in anemic young and middle-aged women despite the fact that the degree of anemia of elderly women was comparable with that of young and middle-aged women. Mean ± SD. a: P < 0.001 between women with and without anemia.
Figure 3.
Figure 3. Scatter plots between serum adiponectin and hemoglobin in young, middle-aged and elderly women.
Figure 4.
Figure 4. Scatter plots between serum adiponectin and age in young, middle-aged and elderly women. Young and middle-aged women were combined and were analyzed together.

Tables

Table 1. Anthropometric, Laboratory and Clinical Characteristics of Young, Middle-Aged and Elderly Japanese Women
 
Young (n = 311)Middle-aged (n = 148)Elderly (n = 322)P#
Mean ± SD or n, %. #P values by ANOVA or Chi-square test. a, b: Young versus middle-aged and elderly, respectively; c: Middle-aged versus elderly: significantly different at P < 0.05 or less by Bonferroni’s multiple comparison procedures. HDL: high-density lipoprotein; SD: standard deviation; ANOVA: analysis of variance.
Age (years)20.5 ± 1.249.8 ± 3.677.9 ± 6.2< 0.001a, b, c
Body mass index (kg/m2)20.4 ± 2.222.0 ± 2.822.4 ± 3.0< 0.001a, b
Cholesterol (mg/dL)182 ± 28224 ± 35218 ± 32< 0.001a, b
HDL cholesterol (mg/dL)75 ± 1377 ± 1665 ± 15< 0.001b, c
Leptin (ng/mL)8.6 ± 3.97.6 ± 4.98.2 ± 5.4ns
Adiponectin (mg/L)11.5 ± 4.311.8 ± 4.915.3 ± 7.8< 0.001b, c
Red blood cells (104/µL)443 ± 32445 ± 32420 ± 35< 0.001b, c
Hemoglobin (g/dL)13.0 ± 1.013.1 ± 1.312.8 ± 1.10.044
Hematocrit (%)40.9 ± 2.941.4 ± 3.640.8 ± 3.1ns
Anemia (n, %)46 (14.8%)18 (12.2%)69 (21.5%)0.021
Hyperadiponectinemia (n, %)12 (3.9%)5 (3.4%)73 (22.7%)< 0.001


Table 2. Features of Elderly Women Divided Into Three Age Groups
 
X (n = 95)Y (n = 176)Z (n = 51)P#
Mean ± SD or n, %. #P values by ANOVA or Chi-square test. a, b: Young versus middle-aged and elderly, respectively; c: Middle-aged versus elderly: significantly different at P < 0.05 or less by Bonferroni’s multiple comparison procedures. X: Between 65 and 74 years; Y: Between 75 and 84 years; Z: Between 85 and 96 years. eGFR: estimated glomerular filtration rate; HDL: high-density lipoprotein; SD: standard deviation; ANOVA: analysis of variance.
Age (years)70.4 ± 2.879.2 ± 2.787.4 ± 2.3< 0.001a, b, c
Body mass index (kg/m2)22.6 ± 3.322.6 ± 2.921.5 ± 2.60.060
Cholesterol (mg/dL)224 ± 33215 ± 32215 ± 300.059
HDL cholesterol (mg/dL)66 ± 1565 ± 1565 ± 150.888
Leptin (ng/mL)8.7 ± 5.28.3 ± 5.66.6 ± 4.50.078
Adiponectin (mg/L)13.9 ± 6.915.1 ± 7.718.7 ± 8.60.001b, c
Red blood cells (104/µL)437 ± 31416 ± 32404 ± 37< 0.001a, b
Hemoglobin (g/dL)13.4 ± 1.012.7 ± 1.012.2 ± 1.1< 0.001a, b, c
Hematocrit (%)42.3 ± 2.640.6 ± 3.038.9 ± 3.3< 0.001a, b, c
Creatinine (mg/dL)0.63 ± 0.090.73 ± 0.150.80 ± 0.23< 0.001a, b, c
eGFR (mL/min/1.73 m2)71 ± 1160 ± 1255 ± 13< 0.001a, b, c
Anemia (n, %)9 (9.5%)40 (22.9%)20 (39.2%)< 0.001
Hyperadiponectinemia (n, %)18 (18.9%)40 (22.7%18 (35.3%)0.079


Table 3. Correlation Coefficients of Serum Adiponectin in Young, Middle-Aged and Elderly Japanese Women
 
YoungMiddle-agedElderly
rPrPrP
aRanges of age (years): young, 18 - 24 years; middle-aged, 39 - 60 years; elderly, 65 - 96 years. HDL: high-density lipoprotein.
Agea-0.0440.0840.201< 0.001
Body mass index-0.203< 0.001-0.252< 0.01-0.353< 0.001
Cholesterol0.0900.1000.037
HDL cholesterol0.286< 0.0010.322< 0.0010.429< 0.001
Leptin-0.182< 0.01-0.185< 0.05-0.346< 0.001
Red blood cells-0.052-0.032-0.351< 0.001
Hemoglobin-0.0230.044-0.318< 0.001
Hematocrit0.0370.042-0.314< 0.001


Table 4. Characteristics of Elderly Japanese Women With Hyperadiponectinemia
 
HyperadiponectinemiaP values
Yes (n = 76)No (n = 246)
Mean ± SD or n, %. HDL: high-density lipoprotein; SD: standard deviation.
Age (years)79 ± 777 ± 60.014
Body mass index (kg/m2)20.9 ± 2.822.9 ± 2.9< 0.001
Cholesterol (mg/dL)222 ± 30217 ± 320.18
HDL cholesterol (mg/dL)75 ± 1562 ± 13< 0.001
Leptin (ng/mL)5.2 ± 3.39.1 ± 5.6< 0.001
Adiponectin (mg/L)26.4 ± 6.311.9 ± 4.2< 0.001
Red blood cells (104/µL)403 ± 34426 ± 33< 0.001
Hemoglobin (g/dL)12.3 ± 1.013.0 ± 1.1< 0.001
Hematocrit (%)39.5 ± 3.141.3 ± 3.0< 0.001
Anemia (n, %)24 (31.6%)45 (18.4%)0.014