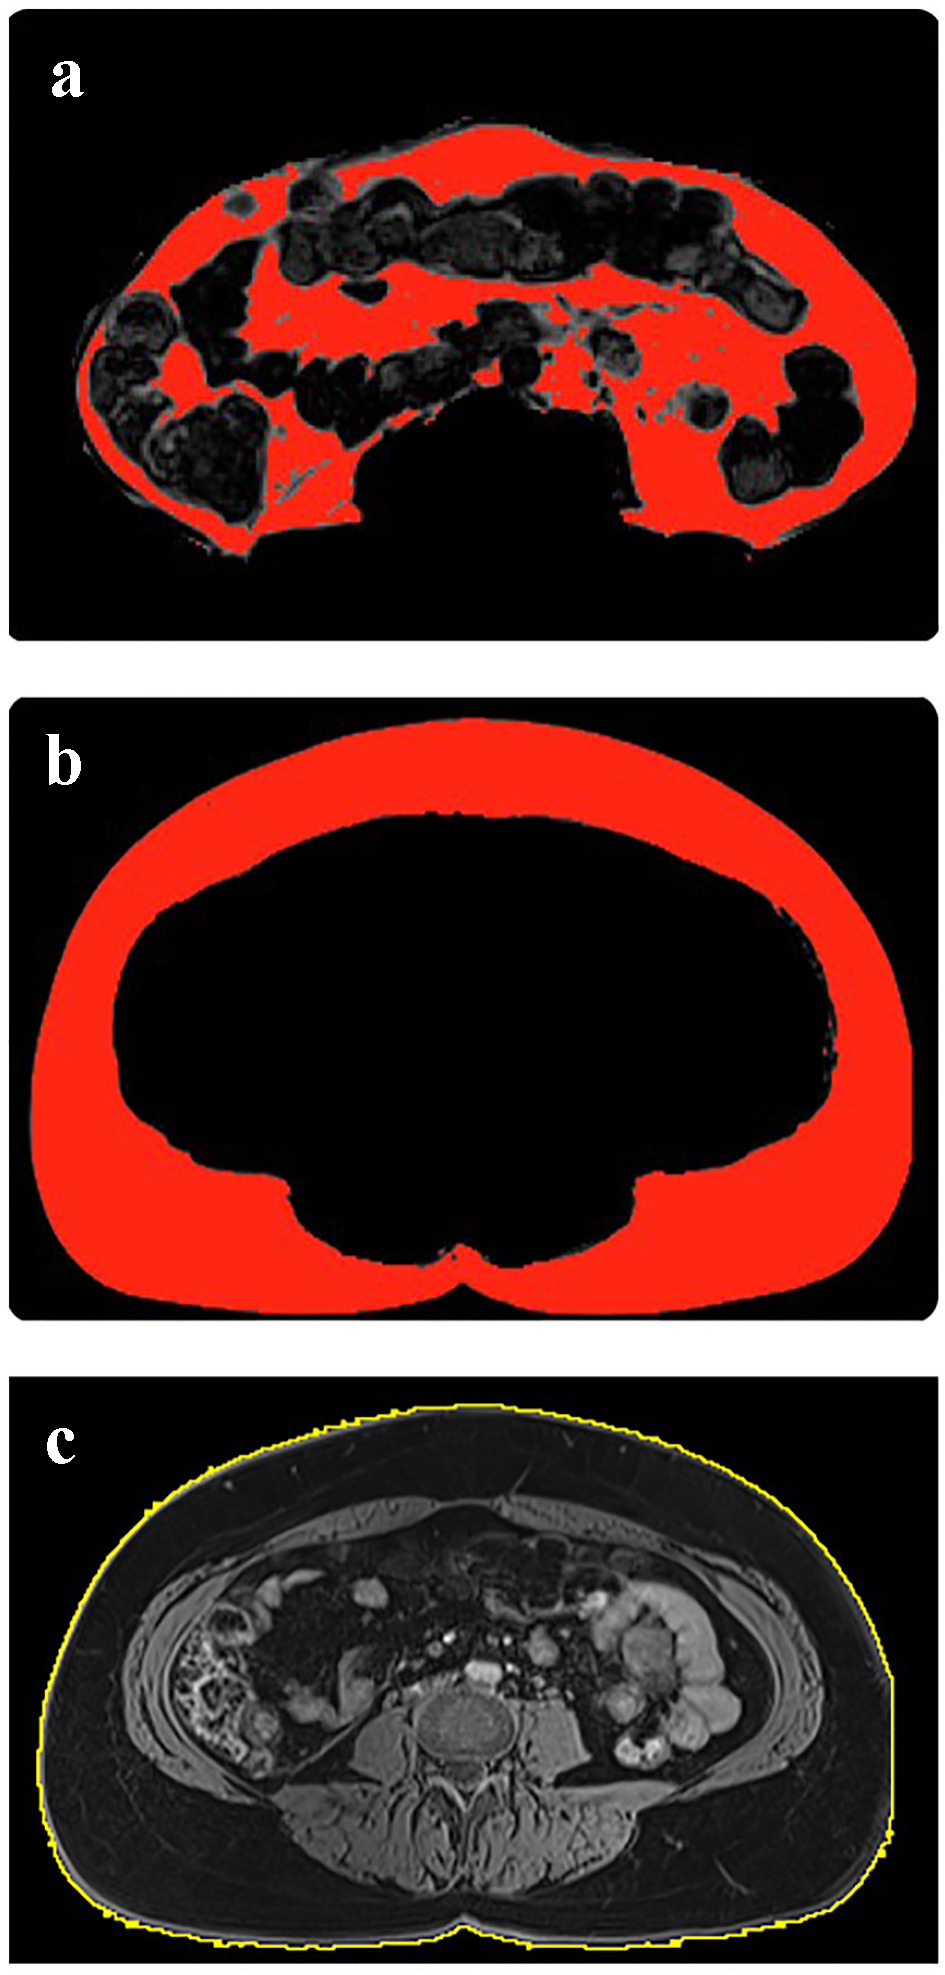
Figure 1. Quantification of visceral adipose tissue volume (a), subcutaneous adipose tissue volume (b) and total abdominal volume (c).
| Journal of Clinical Medicine Research, ISSN 1918-3003 print, 1918-3011 online, Open Access |
| Article copyright, the authors; Journal compilation copyright, J Clin Med Res and Elmer Press Inc |
| Journal website http://www.jocmr.org |
Original Article
Volume 11, Number 6, June 2019, pages 435-446
Relationship of Anthropometric Indices to Abdominal Body Composition: A Multi-Ethnic New Zealand Magnetic Resonance Imaging Study
Figures
Tables
| Characteristics | Total | Caucasian | Maori/PI | Other | P |
|---|---|---|---|---|---|
| Data are presented as mean ± standard deviation or count values. aSignificant differences (P < 0.05). DM: diabetes mellitus; PI: Pacific Islanders. | |||||
| No. of participants | 87 | 37 | 24 | 26 | |
| Age, years | 54.3 ± 1.6 | 58.6 ± 2.5 | 55.9 ± 2.2 | 46.6 ± 2.7 | 0.004a |
| Sex | 0.092 | ||||
| Men | 56 | 19 | 18 | 19 | |
| Women | 31 | 18 | 6 | 7 | |
| Height, cm | 171.9 ± 1.1 | 171.4 ± 1.4 | 174.8 ± 2.3 | 170.1 ± 2.0 | 0.221 |
| Weight, kg | 85.8 ± 2.1 | 82.3 ± 2.2 | 97.3 ± 3.8 | 80.1 ± 4.0 | 0.002a |
| Body mass index, kg/m2 | 28.9 ± 0.7 | 28.0 ± 0.8 | 32.2 ± 1.5 | 27.4 ± 1.0 | 0.012a |
| Waist circumference, cm | 98.9 ± 1.6 | 96.8 ± 2.2 | 106.3 ± 3.1 | 95.2 ± 2.7 | 0.019a |
| Prediabetes/DM | 0.715 | ||||
| Yes | 59 | 26 | 17 | 16 | |
| No | 28 | 11 | 7 | 10 | |
| Etiology of pancreatitis | 0.577 | ||||
| Biliary | 39 | 17 | 8 | 14 | |
| Alcohol-related | 15 | 5 | 6 | 4 | |
| Other | 33 | 15 | 10 | 8 | |
| Recurrence of pancreatitis | 0.972 | ||||
| Yes | 22 | 9 | 6 | 7 | |
| No | 65 | 28 | 18 | 19 | |
| Time since pancreatitis, months | 28.0 ± 2.2 | 28.4 ± 3.2 | 31.7 ± 4.6 | 24.2 ± 4.1 | 0.445 |
| VAT volume (L) | SAT volume (L) | TAb volume (L) | |||||||
|---|---|---|---|---|---|---|---|---|---|
| β coefficient (95% CI) | Odds ratio (95% CI) | P | β coefficient (95% CI) | Odds ratio (95% CI) | P | β coefficient (95% CI) | Odds ratio (95% CI) | P | |
| Model 1 was adjusted for age and sex. Model 2 was adjusted for age, sex and prediabetes/diabetes mellitus status. Model 3 was adjusted for age, sex, prediabetes/diabetes mellitus status, etiology, recurrence and time since acute pancreatitis. aSignificant associations (P < 0.05). PI: Pacific Islanders; SAT: subcutaneous adipose tissue; TAb: total abdominal; VAT: visceral adipose tissue; MRI: magnetic resonance imaging; CI: confidence interval. | |||||||||
| Unadjusted | |||||||||
| Caucasian | Reference | Reference | Reference | ||||||
| Maori/PI | 0.729 | 2.073 (1.219 - 3.525) | 0.007a | 0.185 | 1.203 (0.859 - 1.684) | 0.283 | 0.210 | 1.233 (1.012 - 1.503) | 0.038a |
| Other | 0.086 | 1.090 (0.639 - 1.859) | 0.751 | -0.096 | 0.909 (0.635 - 1.301) | 0.602 | -0.096 | 0.909 (0.747 - 1.105) | 0.338 |
| Model 1 | |||||||||
| Caucasian | Reference | Reference | Reference | ||||||
| Maori/PI | 0.753 | 2.124 (1.146 - 3.937) | 0.017a | 0.358 | 1.431 (0.968 - 2.113) | 0.072 | 0.198 | 1.208 (0.985 - 1.480) | 0.069 |
| Other | 0.165 | 1.179 (0.602 - 2.310 ) | 0.631 | -0.038 | 0.963 (0.950 - 1.443) | 0.854 | -0.123 | 0.884 (0.708 - 1.105) | 0.279 |
| Model 2 | |||||||||
| Caucasian | Reference | Reference | Reference | ||||||
| Maori/PI | 0.755 | 2.128 (1.143 - 3.961) | 0.017a | 0.374 | 1.433 (0.969 - 2.119) | 0.072 | 0.189 | 1.208 (0.985 - 1.481) | 0.069 |
| Other | 0.177 | 1.193 (0.605 - 2.355) | 0.610 | -0.044 | 0.957 (0.638 - 1.437) | 0.957 | -0.128 | 0.880 (0.702 - 1.103) | 0.267 |
| Model 3 | |||||||||
| Caucasian | Reference | Reference | Reference | ||||||
| Maori/PI | 0.764 | 2.146 (1.095 - 4.209) | 0.026a | 0.363 | 1.438 (0.940 - 2.200) | 0.094 | 0.180 | 1.197 (0.958 - 1.495) | 0.114 |
| Other | 0.250 | 1.284 (0.609 - 2.710) | 0.511 | -0.165 | 0.848 (0.544 - 1.323) | 0.848 | -0.168 | 0.846 (0.662 - 1.080) | 0.179 |
| VAT volume (L)a | SAT volume (L) | TAb volume (L) | |||||||
|---|---|---|---|---|---|---|---|---|---|
| R2 | β coefficient (95% CI) | P | R2 | β coefficient (95% CI) | P | R2 | β coefficient (95% CI) | P | |
| Model 1 was adjusted for age and sex. Model 2 was adjusted for age, sex and prediabetes/diabetes mellitus status. Model 3 was adjusted for age, sex, prediabetes/diabetes mellitus status, etiology, recurrence and time since acute pancreatitis. aData were log10 transformed. PI: Pacific Islanders; SAT: subcutaneous adipose tissue; TAb: total abdominal; VAT: visceral adipose tissue; CI: confidence interval. | |||||||||
| Unadjusted | |||||||||
| Total | 0.373 | 33.927 (24.383 - 43.470) | < 0.001 | 0.539 | 7.194 (5.759 - 8.629) | < 0.001 | 0.644 | 4.225 (3.548 - 4.902) | < 0.001 |
| Caucasian | 0.363 | 27.815 (14.973 - 40.658) | < 0.001 | 0.421 | 6.590 (3.937 - 9.243) | < 0.001 | 0.565 | 3.742 (2.615 - 4.869) | < 0.001 |
| Maori/PI | 0.307 | 42.250 (15.166 - 75.335) | 0.005 | 0.508 | 6.674 (3.769 - 6.580) | < 0.001 | 0.687 | 5.183 (3.634 - 6.731) | < 0.001 |
| Other | 0.324 | 32.223 (12.603 - 51.844) | 0.002 | 0.715 | 7.376 (5.414 - 9.338) | < 0.001 | 0.640 | 3.871 (2.647 - 5.095) | < 0.001 |
| Model 1 | |||||||||
| Total | 0.464 | 44.231 (33.662 - 54.801) | < 0.001 | 0.648 | 8.228 (6.891 - 9.566) | < 0.001 | 0.665 | 4.391 (3.703 - 5.078) | < 0.001 |
| Caucasian | 0.403 | 34.452 (18.137 - 50.767) | < 0.001 | 0.556 | 7.291 (4.742 - 9.839) | < 0.001 | 0.581 | 3.992 (2.670 - 5.314) | < 0.001 |
| Maori/PI | 0.569 | 51.165 (26.159 - 76.172) | < 0.001 | 0.612 | 9.756 (5.176 - 14.336) | < 0.001 | 0.746 | 4.779 (3.216 - 6.341) | < 0.001 |
| Other | 0.356 | 38.403 (13.714 - 63.091) | 0.004 | 0.824 | 7.653 (5.836 - 9.470) | < 0.001 | 0.628 | 3.994 (2.397 - 5.591) | < 0.001 |
| Model 2 | |||||||||
| Total | 0.464 | 44.286 (33.646 - 54.926) | < 0.001 | 0.651 | 8.254 (6.911 - 9.597) | < 0.001 | 0.665 | 4.392 (3.700 - 5.083) | < 0.001 |
| Caucasian | 0.414 | 37.053 (19.208 - 54.898) | < 0.001 | 0.556 | 7.299 (4.687 - 9.911) | < 0.001 | 0.587 | 4.099 (2.730 - 5.468) | < 0.001 |
| Maori/PI | 0.607 | 49.434 (23.537 - 75.331) | 0.001 | 0.641 | 9.542 (4.994 - 14.090) | < 0.001 | 0.750 | 4.686 (3.049 - 6.323) | < 0.001 |
| Other | 0.361 | 35.208 (5.759 - 64.656) | 0.021 | 0.824 | 7.708 (5.671 - 10.471) | <0.001 | 0.629 | 4.078 (2.213 - 5.944) | < 0.001 |
| Model 3 | |||||||||
| Total | 0.494 | 46.450 (35.486 - 57.414) | < 0.001 | 0.676 | 8.655 (7.272 - 10.038) | < 0.001 | 0.692 | 4.540 (3.840 - 5.239) | < 0.001 |
| Caucasians | 0.507 | 38.766 (19.700 - 57.832) | < 0.001 | 0.668 | 7.980 (5.216 - 10.743) | < 0.001 | 0.643 | 4.051 (2.556 - 5.546) | < 0.001 |
| Maori/PI | 0.729 | 64.270 (35.571 - 92.969) | < 0.001 | 0.678 | 11.404 (5.486 - 17.321) | 0.001 | 0.814 | 5.439 (3.609 - 7.269) | < 0.001 |
| Other | 0.417 | 39.052 (6.548 - 71.556) | 0.021 | 0.905 | 8.919 (6.915 - 10.924) | < 0.001 | 0.759 | 4.928 (2.946 - 6.911) | < 0.001 |
| Ethnicity/model | VAT volume (L)a | SAT volume (L) | TAb volume (L) | ||||||
|---|---|---|---|---|---|---|---|---|---|
| R2 | β coefficient (95% CI) | P | R2 | β coefficient (95% CI) | P | R2 | β coefficient (95% CI) | P | |
| Model 1 was adjusted for age and sex. Model 2 was adjusted for age, sex and prediabetes/diabetes mellitus status. Model 3 was adjusted for age, sex, prediabetes/diabetes mellitus status, etiology, recurrence and time since acute pancreatitis. PI: Pacific Islanders; SAT: subcutaneous adipose tissue; Tab: total abdominal volume; VAT: visceral adipose tissue; CI: confidence interval. aData were log10 transformed. | |||||||||
| Unadjusted | |||||||||
| Total | 0.337 | 13.376 (9.301 - 17.451) | < 0.001 | 0.688 | 3.354 (2.867 - 3.842) | < 0.001 | 0.713 | 1.835 (1.584 - 2.086) | < 0.001 |
| Caucasian | 0.419 | 11.231 (6.621 - 15.841) | < 0.001 | 0.592 | 2.885 (2.063 - 3.706) | < 0.001 | 0.727 | 1.566 (1.237 - 1.895) | < 0.001 |
| Maori/PI | 0.142 | 15.029 (-0.900 - 30.959) | 0.060 | 0.815 | 4.039 (3.187 - 4.890) | < 0.001 | 0.773 | 2.627 (1.998 - 3.256) | < 0.001 |
| Other | 0.357 | 12.843 (5.574 - 20.111) | 0.001 | 0.704 | 2.780 (2.021 - 3.539) | < 0.001 | 0.672 | 1.507 (1.063 - 1.950) | < 0.001 |
| Model 1 | |||||||||
| Total | 0.470 | 19.295 (14.633 - 23.956) | < 0.001 | 0.752 | 3.697 (3.218 - 4.176) | < 0.001 | 0.769 | 2.014 (1.765 - 2.262) | < 0.001 |
| Caucasian | 0.495 | 15.300 (9.338 - 21.261) | < 0.001 | 0.728 | 3.255 (2.509 - 4.000) | < 0.001 | 0.783 | 1.807 (1.451 - 2.162) | <0.001 |
| Maori/PI | 0.579 | 18.979 (6.803 - 31.155) | 0.004 | 0.869 | 5.389 (4.115 - 6.657) | < 0.001 | 0.875 | 2.285 (1.762 - 2.808) | < 0.001 |
| Other | 0.376 | 15.780 (4.688 - 26.873) | 0.008 | 0.814 | 2.869 (2.160 - 3.578) | < 0.001 | 0.667 | 1.556 (0.982 - 2.129) | < 0.001 |
| Model 2 | |||||||||
| Total | 0.470 | 19.327 (14.628 - 24.025) | < 0.001 | 0.758 | 3.715 (3.238 - 4.193) | < 0.001 | 0.770 | 2.014 (1.764 - 2.264) | < 0.001 |
| Caucasian | 0.496 | 15.592 (9.125 - 22.058) | < 0.001 | 0.738 | 3.205 (2.456 - 3.955) | < 0.001 | 0.783 | 1.802 (1.431 - 2.173) | < 0.001 |
| Maori/PI | 0.588 | 18.324 (5.720 - 30.929) | 0.007 | 0.883 | 5.317 (4.074 - 6.560) | < 0.001 | 0.875 | 2.275 (1.724 - 2.827) | < 0.001 |
| Other | 0.391 | 13.975 (1.093 - 26.856) | 0.035 | 0.815 | 2.821 (2.028 - 3.614) | < 0.001 | 0.667 | 1.550 (0.879 - 2.220) | < 0.001 |
| Model 3 | |||||||||
| Total | 0.499 | 19.941 (15.057 - 24.825) | < 0.001 | 0.769 | 3.846 (3.342 - 4.350) | < 0.001 | 0.786 | 2.059 (1.802 - 2.316) | < 0.001 |
| Caucasian | 0.521 | 14.857 (7.817 - 21.898) | < 0.001 | 0.745 | 3.149 (2.312 - 3.985) | < 0.001 | 0.808 | 1.763 (1.378 - 2.148) | < 0.001 |
| Maori/PI | 0.676 | 21.205 (6.288 - 36.122) | 0.008 | 0.898 | 5.868 (4.273 - 7.463) | < 0.001 | 0.915 | 2.436 (1.846 - 3.027) | < 0.001 |
| Other | 0.441 | 14.749 (0.047 - 29.4503) | 0.049 | 0.883 | 3.296 (2.454 - 4.138) | < 0.001 | 0.740 | 1.813 (1.031 - 2.594) | < 0.001 |
| Caucasian | Maori/PI | Other | |||||||
|---|---|---|---|---|---|---|---|---|---|
| P | VIF | Equation | P | VIF | Equation | P | VIF | Equation | |
| aP < 0.05 (statistical significance). In the equations, sex- men = 0, women = 1. BMI: body mass index; PI: Pacific Islanders; VAT: visceral adipose tissue; VIF: variance inflation factor; WC: waist circumference. | |||||||||
| Age, years | 0.012a | 1.056 | Log10(VAT) = 11.99 (Age) - 1,216.08 (Sex) + 132.09 (BMI) | 0.253 | 1.215 | Log10(VAT) = 54.00 (WC) - 1,134.07 (Sex) | 0.246 | 1.011 | Log10(VAT) = 53.53 (WC) + 24.55 (Height) |
| Sex | 0.009a | 2.090 | 0.022a | 2.703 | 0.374 | 1.806 | |||
| BMI, kg/m2 | 0.003a | 2.001 | - | 127.740 | - | 14.646 | |||
| WC, cm | 0.221 | 2.111 | 0.001a | 4.120 | 0.010a | 1.930 | |||
| Height, cm | 0.933 | 2.131 | 0.753 | 2.628 | 0.024a | 1.124 | |||
| Weight, kg | - | 172.166 | 0.178 | 3.971 | - | 27.468 | |||
| Etiology | 0.959 | 1.577 | 0.372 | 1.294 | 0.351 | 1.053 | |||
| Recurrence | 0.959 | 1.174 | 0.138 | 1.092 | 0.493 | 1.503 | |||
| Time since pancreatitis, months | 0.450 | 1.208 | 0.070 | 1.219 | 0.117 | 1.702 | |||