Journal of Clinical Medicine Research, ISSN 1918-3003 print, 1918-3011 online, Open Access
Article copyright, the authors; Journal compilation copyright, J Clin Med Res and Elmer Press Inc
Journal website http://www.jocmr.org

Original Article

Volume 11, Number 6, June 2019, pages 428-434


Oral Supplementation Using Gamma-Aminobutyric Acid and Whey Protein Improves Whole Body Fat-Free Mass in Men After Resistance Training

Figures

Figure 1.
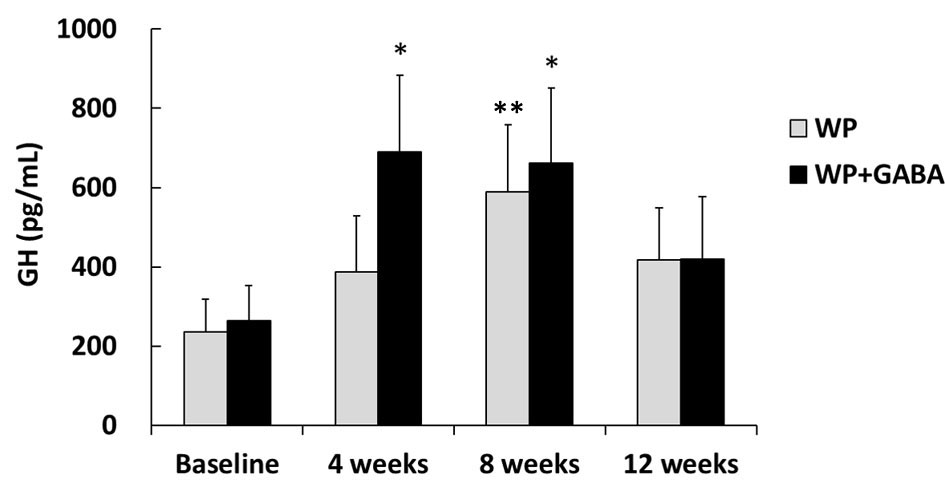
Figure 1. Resting plasma growth hormone concentrations. Values represent the mean ± standard error for 10 subjects (the whey protein group (WP)) or 11 subjects (the whey protein + gamma-aminobutyric acid group (WP + GABA)). *P < 0.05 vs. baseline of the WP + GABA group; **P < 0.05 vs. baseline of the WP group.
Figure 2.
Figure 2. Change in body composition after 12 weeks as measured using dual-energy X-ray absorptiometry. (a) Whole body fat-free mass and (b) arm and leg lean mass. Values represent the mean ± standard error for 10 subjects (the whey protein group (WP)) or 11 subjects (the whey protein + gamma-aminobutyric acid group (WP + GABA)). *P < 0.05 vs. the WP group.

Tables

Table 1. Nutritional Intake Values at Baseline and After 12 Weeks
 
WP groupWP + GABA groupANOVA
Baseline12 weeksBaseline12 weeks
Data are reported as mean ± standard deviation. WP: whey protein; WP + GABA: whey protein + gamma-aminobutyric acid; ANOVA: analysis of variance; G: group effect; T: time effect; G × T: group × time effect.
Energy intake (kcal/day)2,153 ± 1,0342,105 ± 7231,681 ± 5851,761 ± 395G: P = 0.186, T: P = 0.907, G × T: P = 0.651
Protein intake (g/day)69 ± 2475 ± 2461 ± 2662 ± 20G: P = 0.302, T: P = 0.431, G × T: P = 0.488
Carbohydrate intake (g/day)303 ± 170299 ± 125219 ± 79218 ± 58G: P = 0.103, T: P = 0.913, G × T: P = 0.925
Fat intake (g/day)53 ± 1954 ± 1849 ± 2150 ± 15G: P = 0.608, T: P = 0.809, G × T: P = 0.957


Table 2. Maximal Strength Values at Baseline and After 12 Weeks
 
WP groupWP + GABA groupANOVA
Baseline12 weeksBaseline12 weeks
Data are reported as mean ± standard deviation. WP: whey protein; WP + GABA: whey protein + gamma-aminobutyric acid; ANOVA: analysis of variance; G: group effect; T: time effect; G × T: group × time effect.
Leg press (kg)127 ± 31202 ± 53133 ± 38230 ± 74G: P = 0.414, T: P = 0.000, G × T: P = 0.404
Leg extension (kg)64 ± 1791 ± 3364 ± 1391 ± 15G: P = 0.968, T: P = 0.000, G × T: P = 0.947
Leg curl (kg)53 ± 1477 ± 2255 ± 1178 ± 19G: P = 0.866, T: P = 0.000, G × T: P = 0.929
Chest press (kg)52 ± 1165 ± 1363 ± 1478 ± 16G: P = 0.058, T: P = 0.000, G × T: P = 0.727
Pull down (kg)59 ± 1573 ± 1565 ± 1578 ± 15G: P = 0.411, T: P = 0.000, G × T: P = 0.876


Table 3. Body Composition at Baseline and After 12 Weeks
 
WP groupWP + GABA groupANOVA
Baseline12 weeksBaseline12 weeks
Data are reported as mean ± standard deviation. WP: whey protein; WP + GABA: whey protein + gamma-aminobutyric acid; BMI: body mass index; ANOVA: analysis of variance; G: group effect; T: time effect; G × T: group × time effect.
Weight (kg)70.5 ± 8.670.8 ± 9.070.5 ± 8.971.7 ± 10.4G: P = 0.917, T: P = 0.079, G × T: P = 0.252
Fat mass (kg)16.8 ± 4.916.9 ± 5.416.4 ± 5.616.3 ± 6.3G: P = 0.846, T: P = 0.957, G × T: P = 0.773
BMI (kg/m2)23.3 ± 2.223.4 ± 2.324.2 ± 3.624.6 ± 4.1G: P = 0.501, T: P = 0.089, G × T: P = 0.247
Whole body fat-free mass (kg)50.9 ± 4.751.0 ± 4.651.2 ± 5.452.5 ± 6.2G: P = 0.714, T: P = 0.011, G × T: P = 0.037
Arm and leg lean mass (kg)23.0 ± 2.323.6 ± 2.723.4 ± 2.824.2 ± 2.9G: P = 0.695, T: P = 0.001, G × T: P = 0.584