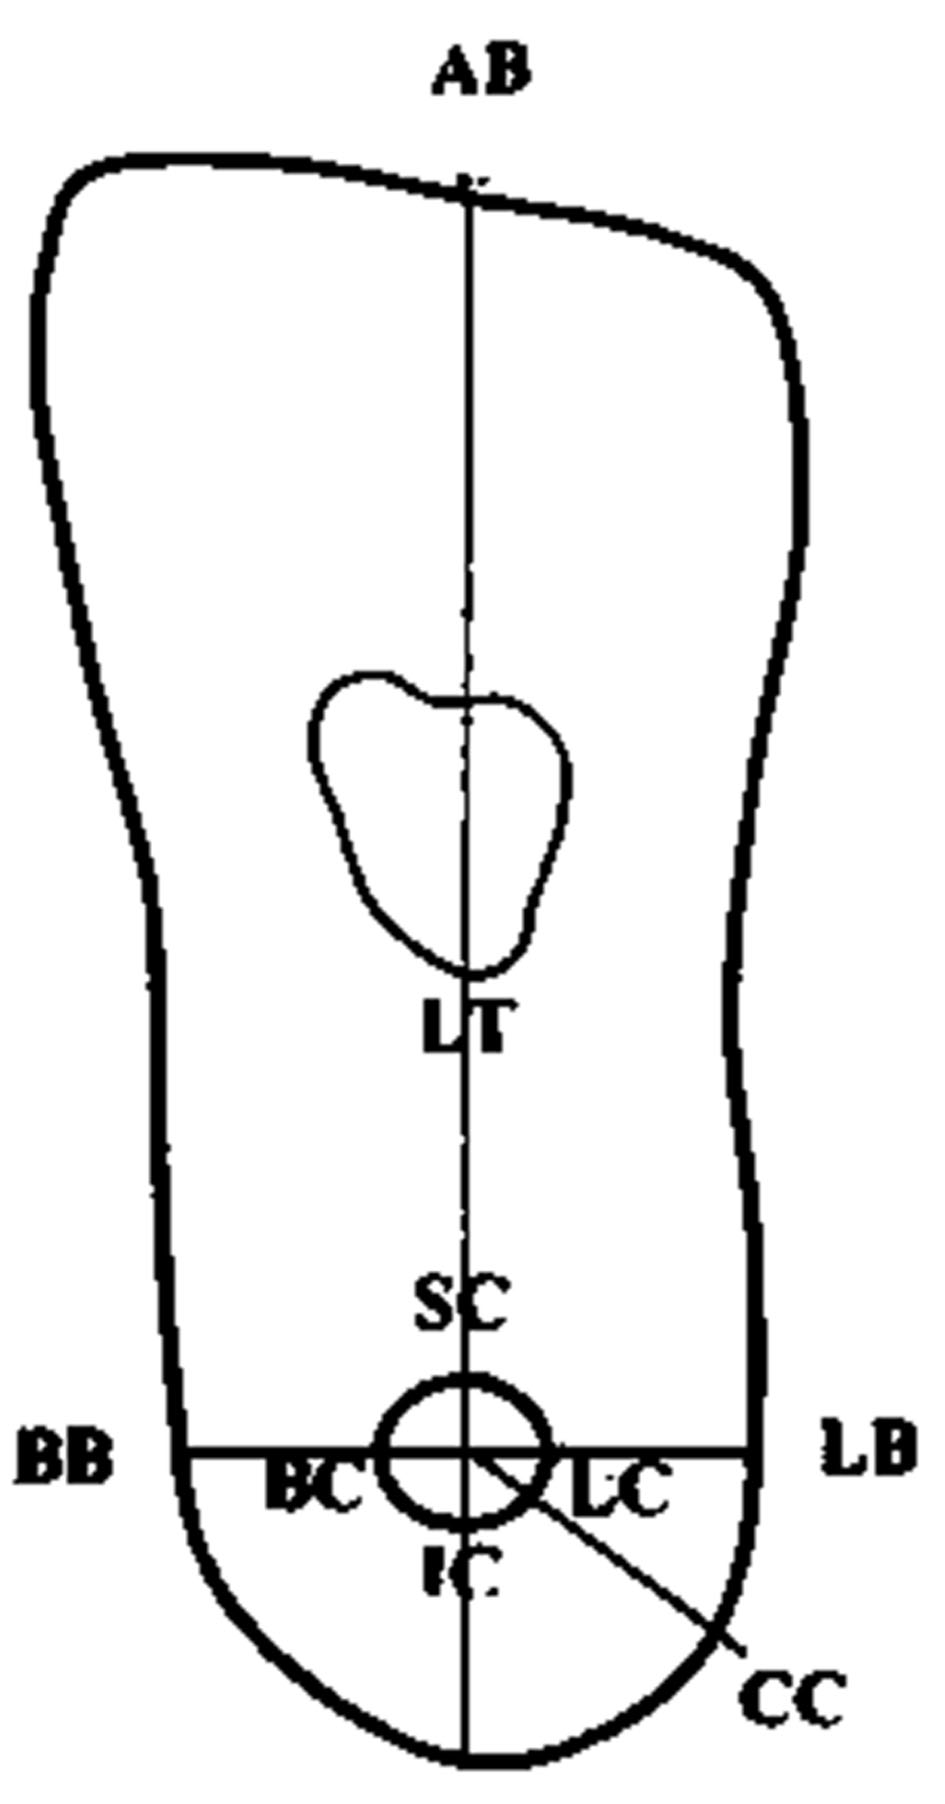
Figure 1. The measurement of nine reference points and seven reference lines of coronal view in cone beam computed tomography.
| Journal of Clinical Medicine Research, ISSN 1918-3003 print, 1918-3011 online, Open Access |
| Article copyright, the authors; Journal compilation copyright, J Clin Med Res and Elmer Press Inc |
| Journal website http://www.jocmr.org |
Original Article
Volume 11, Number 5, May 2019, pages 353-359
The Study of Inferior Alveolar Canal at the Lower Third Molar Apical Region With Cone Beam Computed Tomography
Figures

Tables
| Age (years) | Gender | Total | |
|---|---|---|---|
| Male | Female | ||
| 20 - 29 | 36 | 34 | 70 |
| 30 - 39 | 9 | 10 | 19 |
| 40 - 49 | 0 | 1 | 1 |
| Total | 45 | 45 | 90 |
| Point of reference |
|---|
| 1. BB: the outer surface of buccal cortex |
| 2. LB: the outer surface of lingual cortex |
| 3. BC: the buccal border of inferior alveolar canal |
| 4. LC: the lingual border of inferior alveolar canal |
| 5. SC: the superior of inferior alveolar canal |
| 6. IC: the inferior border of inferior alveolar canal |
| 7. AB: the alveolar crest |
| 8. LT: the lower part of tooth |
| Line of reference |
| 1. BB to LB: mandible width |
| 2. BB to BC: buccal bone width |
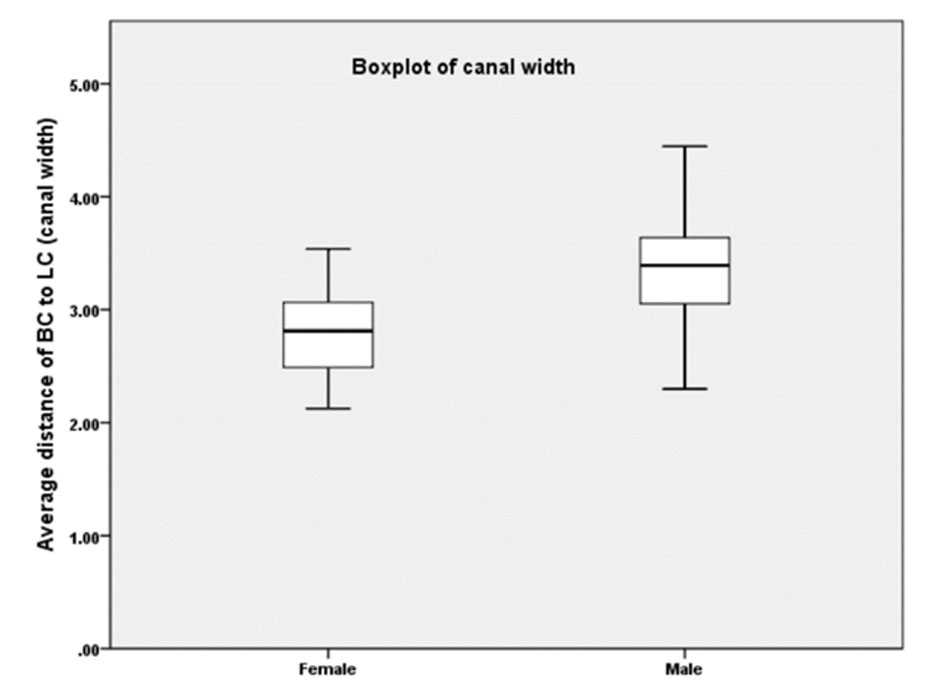
| 3. BC to LC: canal width |
| 4. LC to LB: lingual bone width |
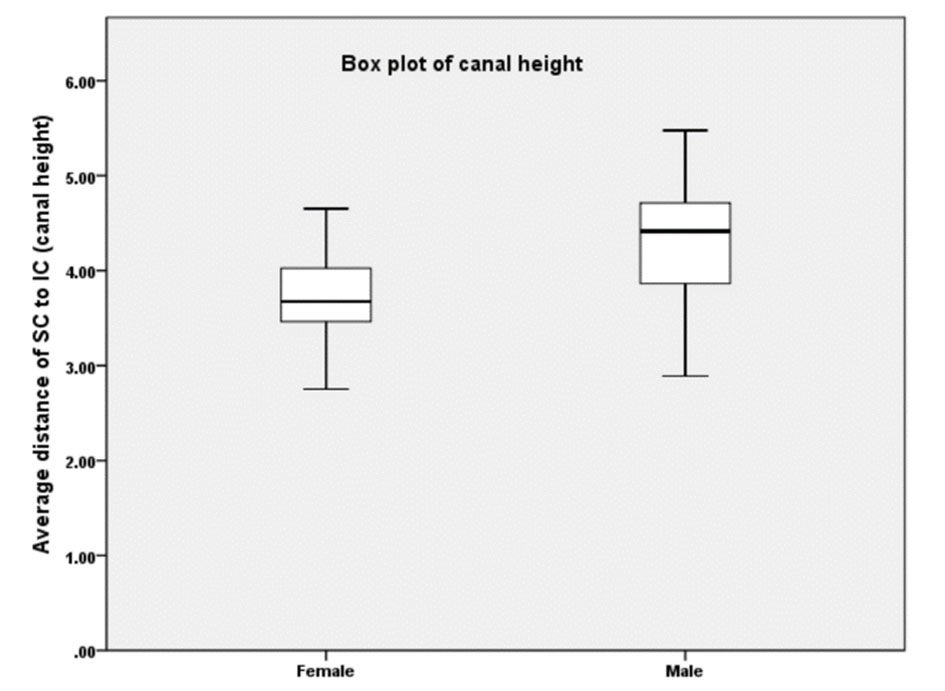
| 5. SC to IC: canal height |
| 6. AB to SC: alveolar bone height |
| Left | Right | |||||
|---|---|---|---|---|---|---|
| BB-LB | BC-LC | SC-IC | BB-LB | BC-LC | SC-IC | |
| *P value < 0.05. | ||||||
| Mesial | ||||||
| Female | 12.37 ± 2.56 | 2.99 ± 0.83 | 3.45 ± 0.71 | 12.41 ± 2.03 | 2.93 ± 0.50 | 3.46 ± 0.60 |
| Male | 13.35 ± 1.98 | 3.38 ± 0.57 | 4.19 ± 0.81 | 13.73 ± 2.67 | 3.56 ± 0.97 | 3.87 ± 0.67 |
| P value | 0.046* | 0.003* | 0.000* | 0.017* | 0.000* | 0.000* |
| Middle | ||||||
| Female | 11.40 ± 2.09 | 2.64 ± 0.74 | 3.40 ± 0.78 | 11.27 ± 1.84 | 2.81 ± 0.59 | 3.35 ± 0.73 |
| Male | 12.32 ± 2.05 | 3.29 ± 0.79 | 4.19 ± 1.04 | 12.51 ± 2.04 | 3.27 ± 0.80 | 3.87 ± 0.88 |
| P value | 0.039* | 0.000* | 0.000* | 0.039* | 0.000* | 0.000* |
| Distal | ||||||
| Female | 11.41 ± 2.00 | 2.83 ± 0.66 | 3.41 ± 0.64 | 11.28 ± 1.89 | 2.82 ± 0.60 | 3.55 ± 0.86 |
| Male | 12.69 ± 2.04 | 3.19 ± 0.76 | 3.97 ± 0.86 | 12.83 ± 2.11 | 3.38 ± 0.72 | 4.04 ± 1.49 |
| P value | 0.006* | 0.029* | 0.001* | 0.003* | 0.000* | 0.043* |
| M-root | ||||||
| Female | 10.25 ± 2.45 | 2.64 ± 0.85 | 3.93 ± 1.01 | 10.31 ± 2.39 | 2.87 ± 0.75 | 3.90 ± 1.15 |
| Male | 11.72 ± 2.11 | 3.29 ± 0.83 | 4.68 ± 1.25 | 11.34 ± 2.04 | 3.39 ± 0.67 | 4.68 ± 1.22 |
| P value | 0.003* | 0.000* | 0.002* | 0.003* | 0.000* | 0.000* |
| D-root | ||||||
| Female | 9.91 ± 2.08 | 2.64 ± 0.57 | 4.18 ± 1.12 | 9.99 ± 1.85 | 2.79 ± 0.59 | 3.97 ± 1.14 |
| Male | 11.40 ± 1.87 | 3.36 ± 0.78 | 4.89 ± 1.34 | 10.98 ± 1.84 | 3.35 ± 0.63 | 4.68 ± 1.05 |
| P value | 0.001* | 0.000* | 0.004* | 0.001* | 0.000* | 0.001* |
| Gender | Average means of measurement | ||||||
|---|---|---|---|---|---|---|---|
| BB-LB | BB-BC | BC-LC | LC-LB | SC-IC | AB-SC | LT-SC | |
| *P value < 0.05. | |||||||
| Female | 11.06 ± 1.77 | 6.01 ± 1.77 | 2.79 ± 0.37 | 2.26 ± 1.27 | 3.66 ± 0.48 | 14.08 ± 2.14 | 1.76 ± 0.96 |
| Male | 12.29 ± 1.56 | 6.39 ± 1.84 | 3.35 ± 0.48 | 2.55 ± 1.06 | 4.31 ± 0.62 | 15.52 ± 2.42 | 1.69 ± 1.05 |
| P value | 0.017* | 0.660 | 0.029* | 0.997 | 0.002* | 0.158 | 0.984 |