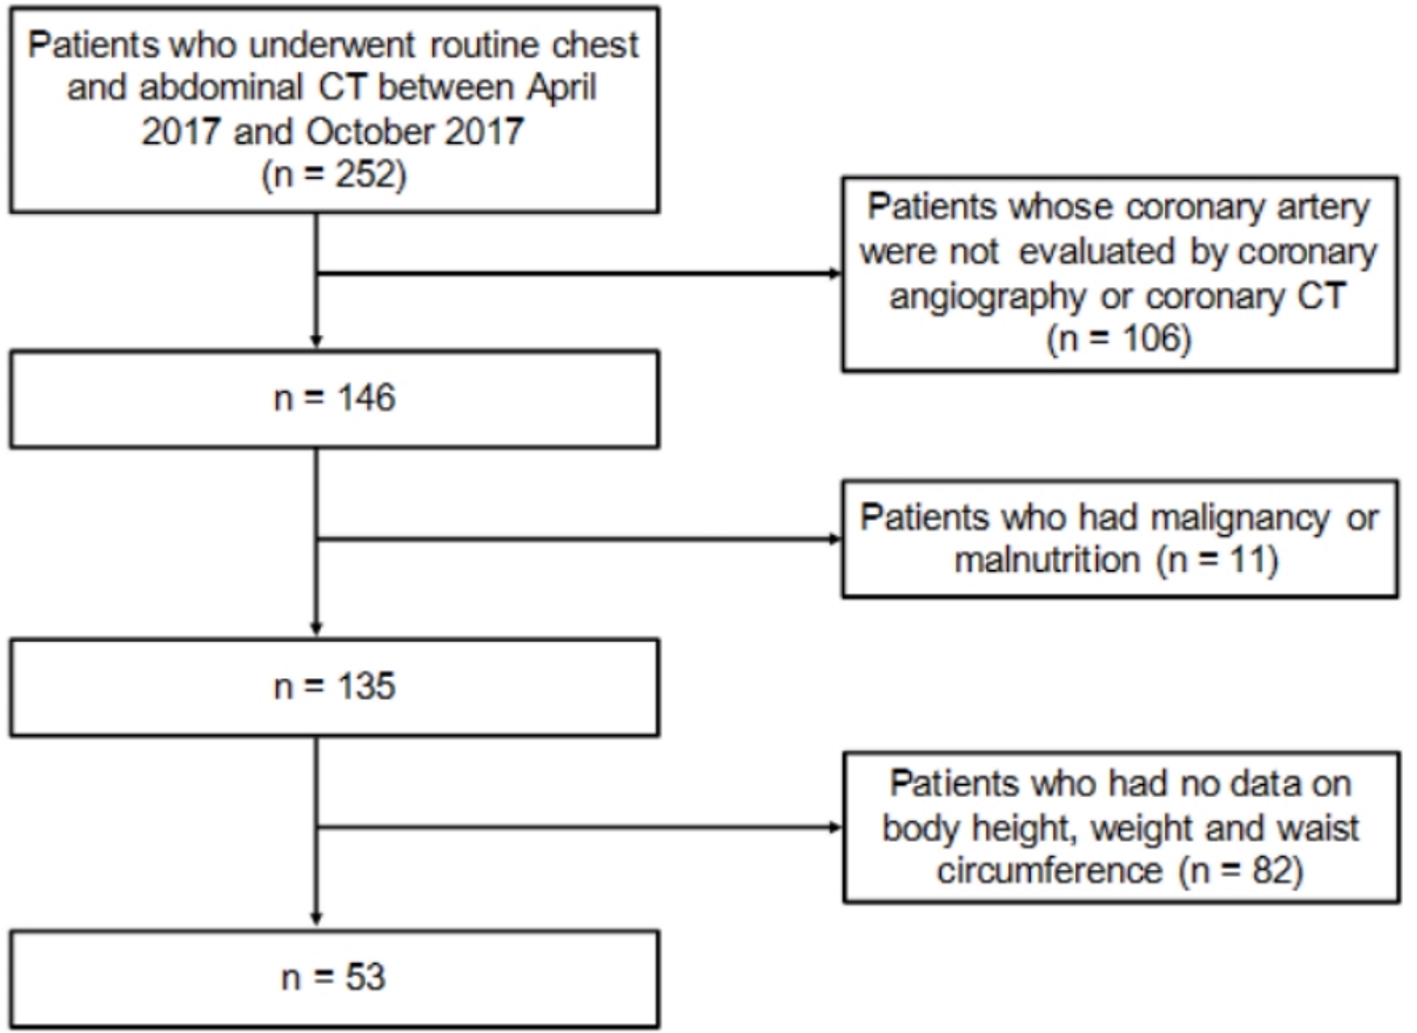
Figure 1. Recruitment of patients studied.
| Journal of Clinical Medicine Research, ISSN 1918-3003 print, 1918-3011 online, Open Access |
| Article copyright, the authors; Journal compilation copyright, J Clin Med Res and Elmer Press Inc |
| Journal website http://www.jocmr.org |
Original Article
Volume 11, Number 4, April 2019, pages 289-296
Associations of Pericardial Fat Area Determined by Routine Chest Computed Tomography With Coronary Risk Factors and Coronary Artery Disease
Figures
Tables
| CT: computed tomography; E/A: the ratio of E wave (early diastolic filling velocity) to A wave (atrial filling velocity); E/e’: the ratio of E wave (early diastolic filling velocity) to e’ wave (peak early diastolic velocity); HDL-C: high-density lipoprotein-cholesterol; LDL-C: low-density lipoprotein-cholesterol. | ||
| Sex, male | n (%) | 31 (58.5%) |
| Age (years) | mean ± SD | 75.2 ± 7.5 |
| Body height (cm) | mean ± SD | 158.0 ± 11.0 |
| Body weight (kg) | mean ± SD | 60.0 ± 13.0 |
| Body mass index (kg/m2) | mean ± SD | 23.9 ± 3.9 |
| Waist circumference (cm) | mean ± SD | 88.1 ± 11.6 |
| Life-style related diseases and coronary artery disease | ||
| Diabetes | n (%) | 40 (75.4%) |
| Hypertension | n (%) | 25 (47.1%) |
| Dyslipidemia | n (%) | 43 (81.1%) |
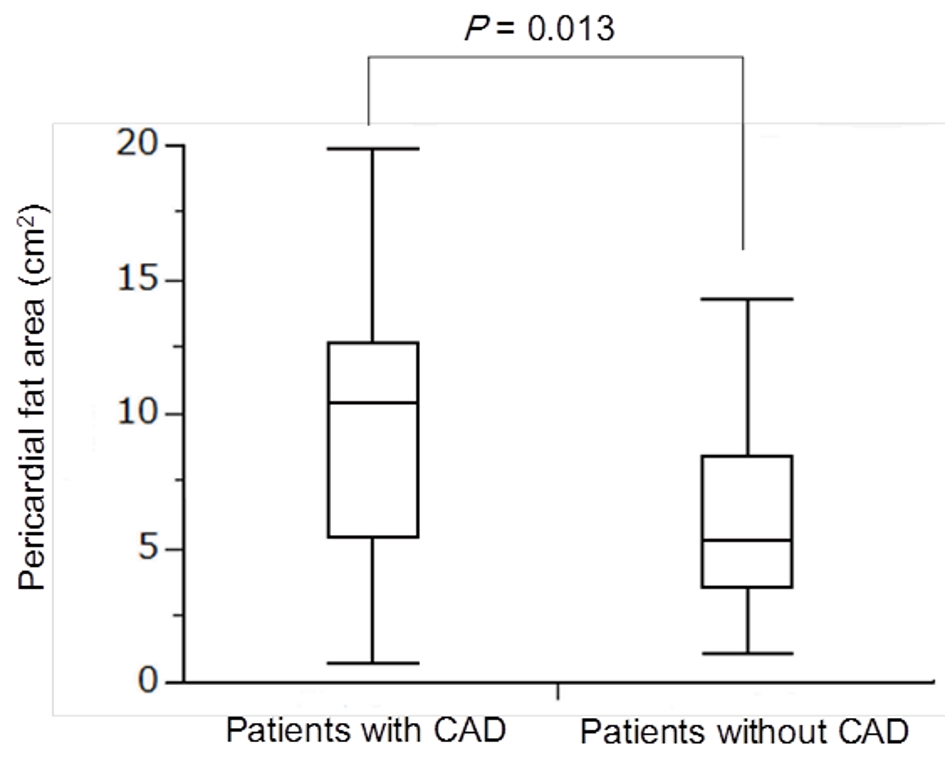
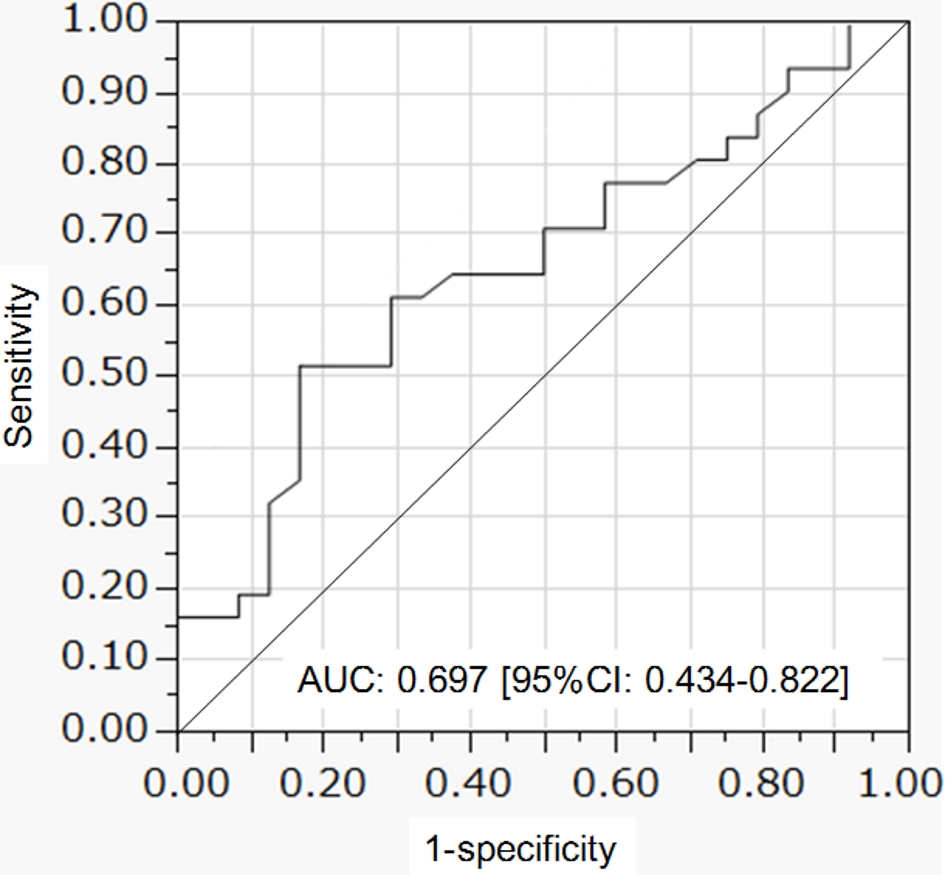
| Coronary artery disease | n (%) | 28 (52.8%) |
| Fat area measured by CT | ||
| Subcutaneous fat area (cm2) | mean ± SD | 114.7 ± 62.3 |
| Visceral fat area (cm2) | mean ± SD | 104.5 ± 62.6 |
| Pericardial fat area (cm2) | mean ± SD | 7.96 ± 4.81 |
| Lipids and glucose metabolism | ||
| Serum triglyceride (mg/dL) | mean ± SD | 116.6 ± 73.0 |
| Serum LDL-C (mg/dL) | mean ± SD | 96.2 ± 20.2 |
| Serum HDL-C (mg/dL) | mean ± SD | 55.5 ± 18.5 |
| Hemoglobin A1c (%) | mean ± SD | 6.8 ± 1.1 |
| Finding measured by chest X-ray, cardio-thoracic ratio (%) | mean ± SD | 50.4 ± 6.7 |
| Findings measured by echocrdiography | ||
| Ejection fraction (%) | mean ± SD | 62.3 ± 9.4 |
| E/A | mean ± SD | 0.87 ± 0.30 |
| E/e’ | mean ± SD | 13.0 ± 3.4 |
| Findings measured by carotid ultrasonography, intima-media thickness (mm) | mean ± SD | 1.75 ± 0.40 |
| Correlation coefficient | P value | |
|---|---|---|
| E/A: the ratio of E wave (early diastolic filling velocity) to A wave (atrial filling velocity); E/e’: the ratio of E wave (early diastolic filling velocity) to e’ wave (peak early diastolic velocity); HDL-C: high-density lipoprotein-cholesterol; LDL-C: low-density lipoprotein-cholesterol. | ||
| Body mass index | 0.605 | < 0.0001 |
| Waist circumference | 0.753 | < 0.0001 |
| Subcutaneous fat area | 0.541 | < 0.0001 |
| Visceral fat area | 0.74 | < 0.0001 |
| Serum triglyceride | 0.204 | 0.1423 |
| Serum LDL-C | 0.106 | 0.4519 |
| Serum HDL-C | -0.453 | 0.0007 |
| Hemoglobin A1c | 0.262 | 0.0584 |
| Cardio-thoracic ratio | 0.133 | 0.454 |
| Ejection fraction | -0.214 | 0.1973 |
| E/A | -0.209 | 0.2293 |
| E/e’ | 0.196 | 0.6742 |
| Intima-media thickness | 0.3 | 0.0895 |
| Odds ratio | 95% confidence interval | P value | |
|---|---|---|---|
| Age | 1.04 | 0.917 - 1.186 | 0.5416 |
| Sex, male | 1.909 | 0.211 - 22.18 | 0.564 |
| Body mass index | 1.002 | 1.606 - 1.626 | 0.9943 |
| Waist circumference | 1.222 | 1.005 - 1.580 | 0.044 |
| Diabetes | 0.445 | 0.025 - 4.435 | 0.5052 |
| Hypertension | 1.557 | 0.237 - 12.39 | 0.6462 |
| Dyslipidemia | 0.327 | 0.016 - 3.427 | 0.367 |