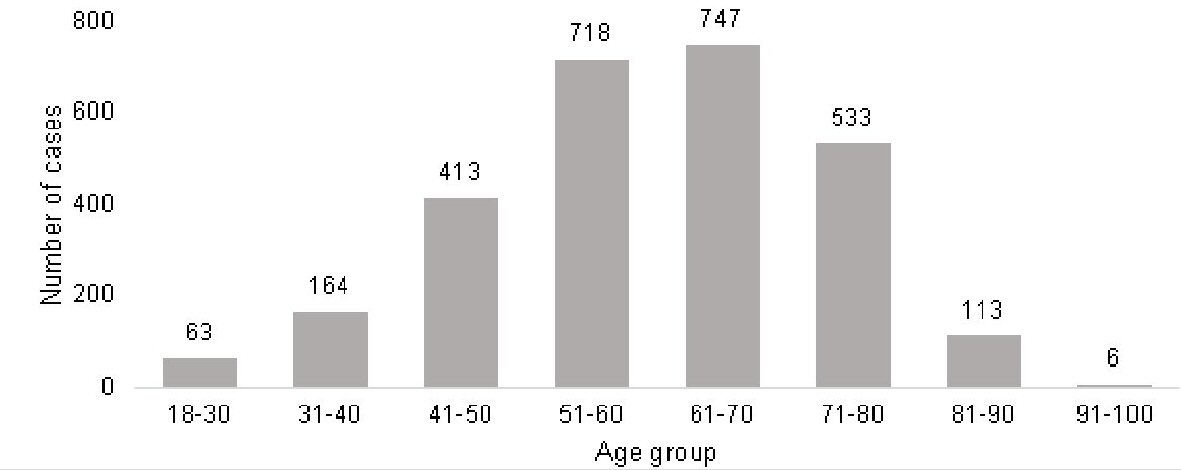
Figure 1. Number of patients per age group that started treatments in the service of Oncology at the University Hospital of Santa Maria from 2011 to 2016.
| Journal of Clinical Medicine Research, ISSN 1918-3003 print, 1918-3011 online, Open Access |
| Article copyright, the authors; Journal compilation copyright, J Clin Med Res and Elmer Press Inc |
| Journal website http://www.jocmr.org |
Original Article
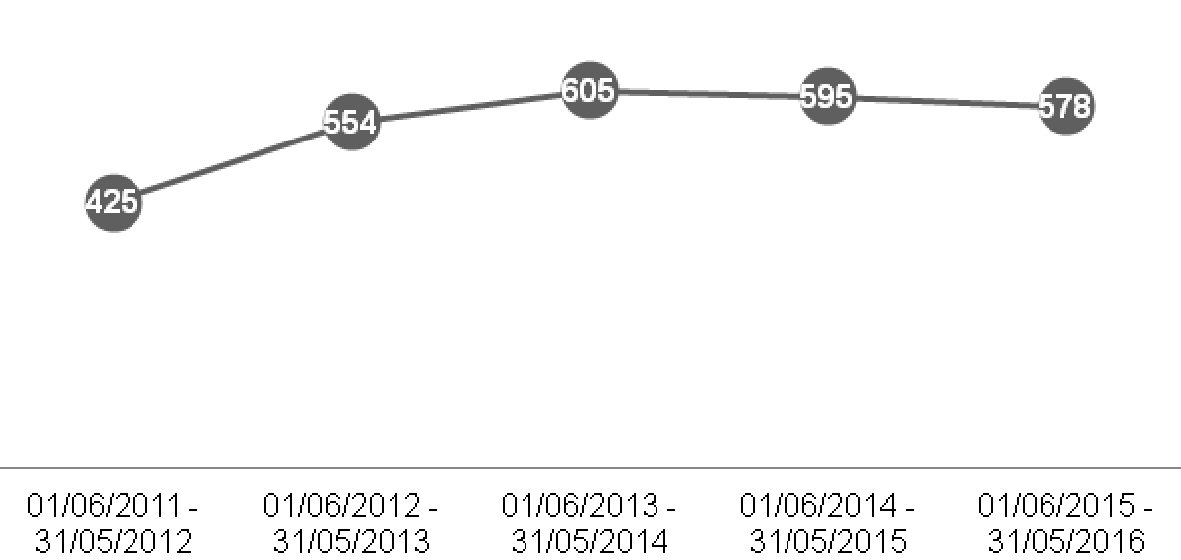
Volume 11, Number 4, April 2019, pages 275-282
Prevalence of Solid Neoplasms Diagnosed Between the Years of 2011 to 2016 and Oncologically Treated at the University Hospital of Santa Maria
Figures
Tables
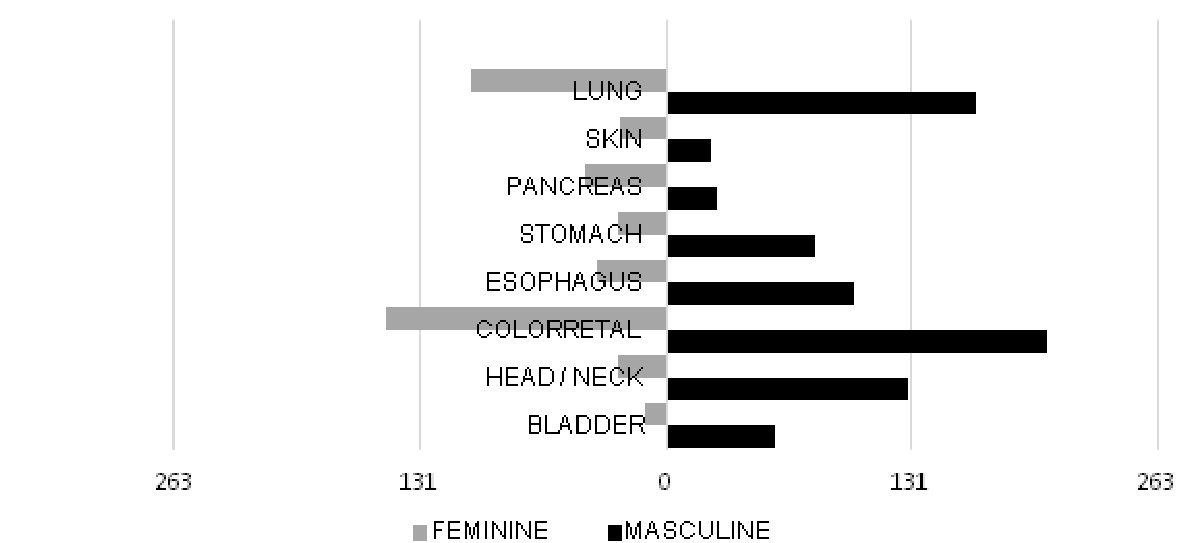
| Primary site | Number | % |
|---|---|---|
| Breast | 823 | 29.85% |
| Prostate | 385 | 13.96% |
| Colorectal | 352 | 12.77% |
| Lung | 270 | 9.79% |
| Head/neck | 155 | 5.62% |
| Esophagus | 137 | 4.97% |
| Stomach | 106 | 3.84% |
| Uterine cervix | 104 | 3.77% |
| Pancreas | 71 | 2.58% |
| Bladder | 70 | 2.54% |
| Ovary | 49 | 1.78% |
| Skin | 49 | 1.78% |
| Body uterus/endometrium | 33 | 1.20% |
| Testicles | 31 | 1.12% |
| Unknown/without specific location | 25 | 0.91% |
| Sarcoma soft tissues | 20 | 0.73% |
| Bile duct | 18 | 0.65% |
| Anus/anal canal | 10 | 0.36% |
| Liver | 8 | 0.29% |
| Kidney | 7 | 0.25% |
| Brain | 6 | 0.22% |
| Small intestine | 6 | 0.22% |
| Vulva | 6 | 0.22% |
| Placenta | 5 | 0.18% |
| Heart/mediastinum/pleura | 3 | 0.11% |
| Penis | 3 | 0.11% |
| Thyroid gland | 1 | 0.04% |
| Spinal cord | 1 | 0.04% |
| Bone | 1 | 0.04% |
| Vagina | 1 | 0.04% |
| Thymus | 1 | 0.04% |
| Total | 2,757 | 100.00% |
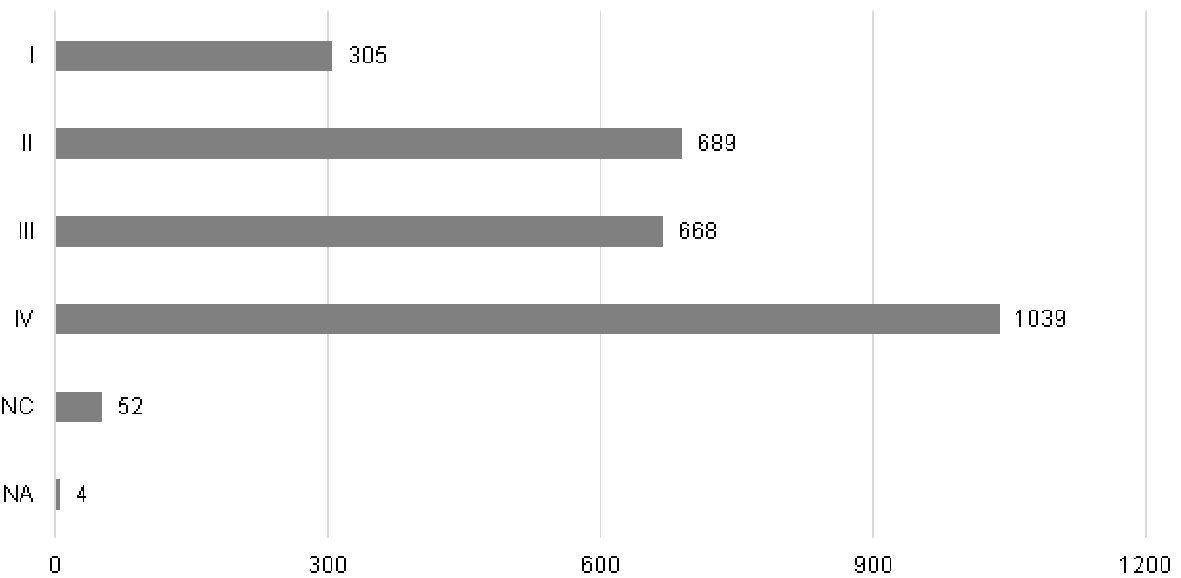
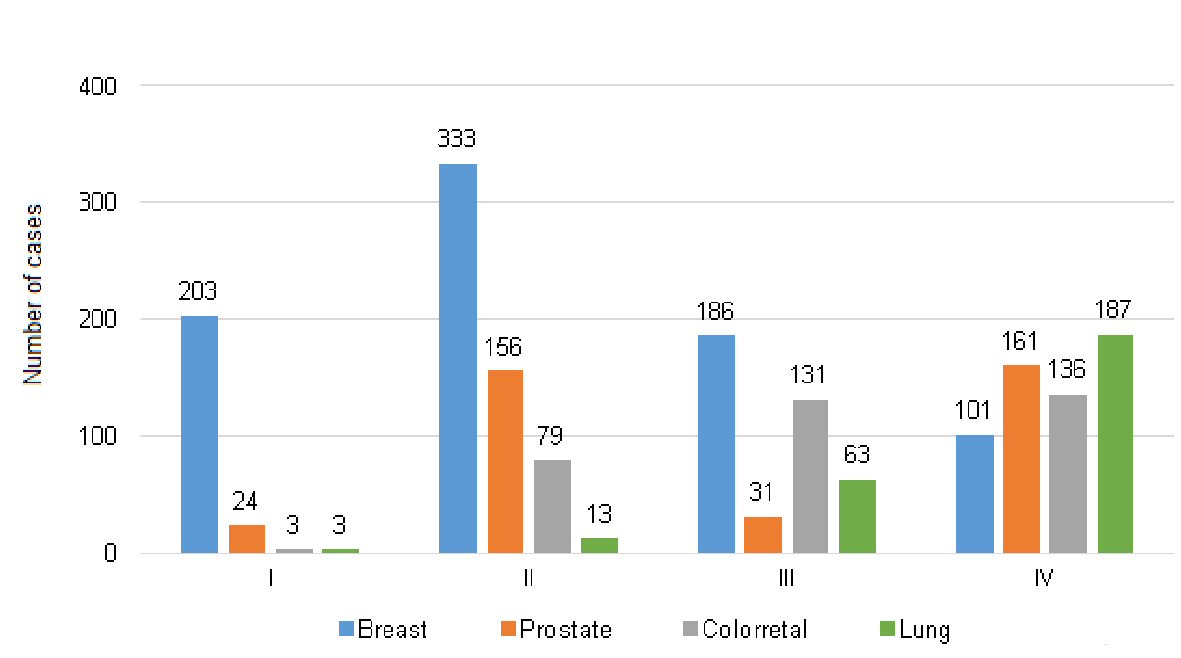
| Tumor stage | Number | % |
|---|---|---|
| NA: not applicable; NS: not stated. | ||
| I | 305 | 11.06% |
| II | 689 | 24.99% |
| III | 668 | 24.23% |
| IV | 1,039 | 37.69% |
| NA | 4 | 0.15% |
| NS | 52 | 1.89% |
| Total | 2.757 | 100.00% |