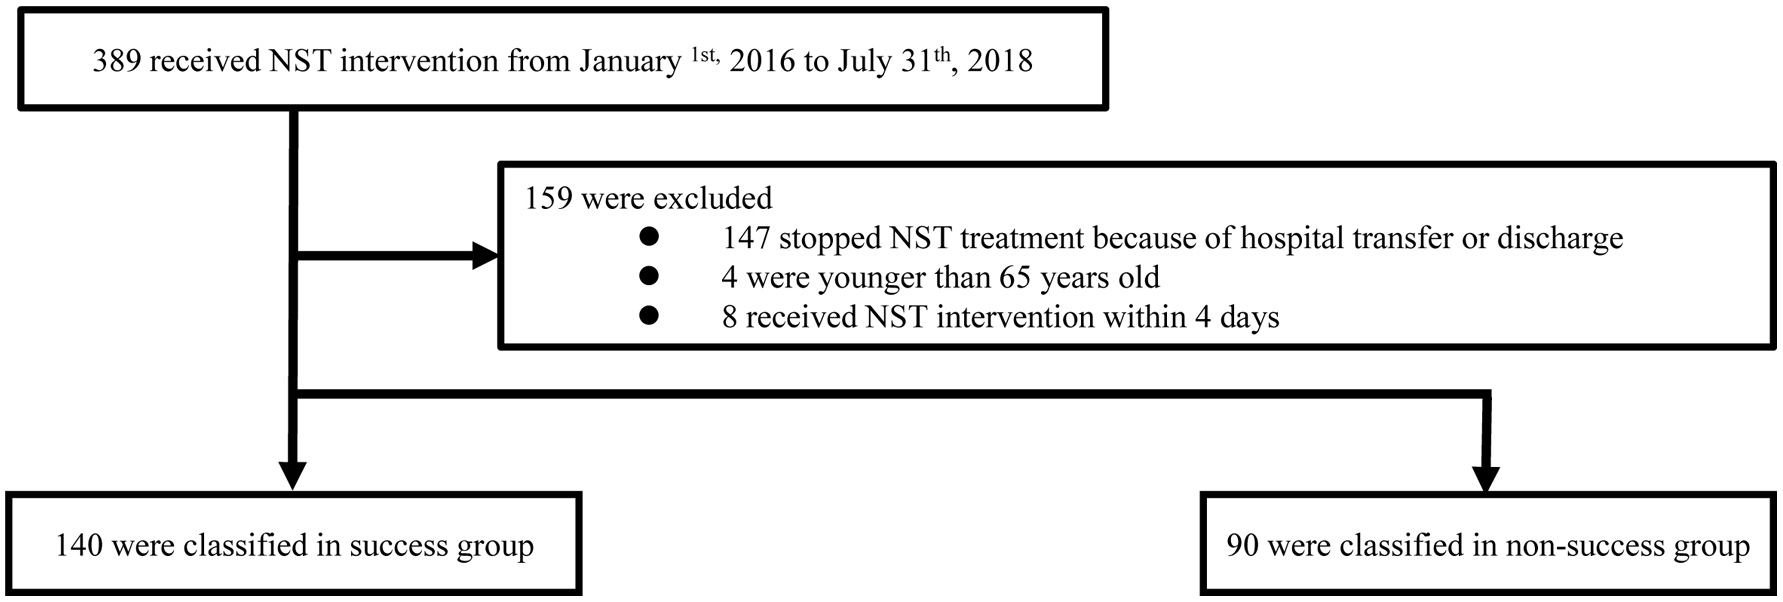
Figure 1. Flow chart of participant selection in this study.
| Journal of Clinical Medicine Research, ISSN 1918-3003 print, 1918-3011 online, Open Access |
| Article copyright, the authors; Journal compilation copyright, J Clin Med Res and Elmer Press Inc |
| Journal website http://www.jocmr.org |
Original Article
Volume 11, Number 7, July 2019, pages 472-479
Association Between Risk Factors and Intensive Nutritional Intervention Outcomes in Elderly Individuals
Figure
Tables
| Successful group (n = 140) | Non-successful group (n = 90) | P value | |||
|---|---|---|---|---|---|
| Data are expressed as median (25th - 75th percentile) or percentage (n). The differences between the two groups were analyzed using the Fisher’s exact test, Chi-square test, and Mann-Whitney U test. BMI: body mass index; CCI: Charlson Comorbidity Index; SGA: subjective global assessment; %TEE: the energy fill rate to total energy expenditure; NST: nutrition support team. | |||||
| Age (years) | 85.0 | (79.0 - 89.0) | 84.0 | (78.8 - 89.0) | 0.426 |
| Sex (men) | 35.0% | (49) | 51.1% | (46) | 0.020 |
| BMI (kg/m2) | 18.7 | (16.4 - 21.0) | 18.4 | (16.1 - 21.5) | 0.863 |
| Lack of data | (3) | (5) | |||
| CCI (points) | |||||
| Low, 0 | 17.9% | (25) | 15.6% | (14) | 0.464 |
| Medium, 1 - 2 | 46.4% | (65) | 42.2% | (38) | |
| High, 3 - 4 | 20.7% | (29) | 18.9% | (17) | |
| Very high, ≥ 5 | 15.0% | (21) | 23.3% | (21) | |
| SGA score (points) | |||||
| Normal, 0 | 11.4% | (15) | 5.8% | (5) | 0.102 |
| Light, 1 - 2 | 34.1% | (45) | 24.4% | (21) | |
| Moderate, 3 - 4 | 34.1% | (45) | 48.8% | (42) | |
| Severe, 5 - 10 | 20.5% | (27) | 20.9% | (18) | |
| Lack of data | (8) | (4) | |||
| Presence of dysphagia | 48.9% | (68) | 58.9% | (53) | 0.175 |
| Lack of data | (1) | (0) | |||
| Presence of bedsore | 11.4% | (15) | 17.4% | (15) | 0.230 |
| Lack of data | (8) | (4) | |||
| %TEE (%) | 66.0 | (44.8 - 82.1) | 56.3 | (36.2 - 73.2) | 0.004 |
| Duration of NST intervention (days) | 36.0 | (22.0 - 50.0) | 22.0 | (14.0 - 43.0) | < 0.001 |
| Successful group (n = 140) | Non-successful group (n = 90) | P value | |||||
|---|---|---|---|---|---|---|---|
| n | n | ||||||
| Data are expressed as median (25th - 75th percentile). The differences between the two groups were analyzed using the Mann-Whitney U test. Alb: albumin; TLC: total lymphocyte count; T-Cho: total cholesterol; CRP: C-reactive protein; TTR: transthyretin; Hb: hemoglobin; TG: triglyceride; CONUT: controlling nutritional status; PNI: Onodera’s prognostic nutritional index; GNRI: geriatric nutritional risk index. | |||||||
| Alb level (g/dL) | 140 | 2.4 | (2.0 - 2.7) | 90 | 2.2 | (1.8 - 2.6) | 0.004 |
| TLC level (/µL) | 136 | 1,160 | (825 - 1575) | 86 | 1,100 | (760 - 1605) | 0.710 |
| T-Cho level (mg/dL) | 122 | 137 | (106 - 160) | 76 | 133 | (102 - 161) | 0.771 |
| CRP level (mg/dL) | 139 | 2.16 | (0.83 - 4.80) | 90 | 4.25 | (1.39 - 9.08) | 0.001 |
| TTR level (mg/dL) | 113 | 10.4 | (7.5 - 14.0) | 68 | 8.3 | (5.2 - 10.8) | 0.002 |
| Hb level (g/dL) | 139 | 9.2 | (8.4 - 10.5) | 90 | 9.2 | (8.3 - 10.6) | 0.930 |
| TG level (mg/dL) | 122 | 90 | (63 - 111) | 69 | 89 | (66 - 116) | 0.607 |
| CONUT score | 122 | 8.0 | (6.0 - 10.0) | 76 | 8.5 | (7.0 - 10.0) | 0.304 |
| PNI score | 136 | 29.6 | (25.8 - 34.5) | 86 | 27.2 | (23.3 - 32.5) | 0.017 |
| GNRI score | 137 | 72.0 | (64.3 - 78.2) | 85 | 67.8 | (61.0 - 73.4) | 0.003 |
| Successful group (n = 140) | Non-successful group (n = 90) | P value | |||
|---|---|---|---|---|---|
| Data are expressed as percentage (n). The differences between the two groups were analyzed using the Fisher’s exact test. PEG: percutaneous endoscopic gastrostomy. | |||||
| Total parenteral nutrition | 16.4% | (23) | 24.4% | (22) | 0.173 |
| Peripheral parenteral nutrition | 32.1% | (45) | 47.8% | (43) | 0.019 |
| Nasal tube feeding | 6.4% | (9) | 4.4% | (4) | 0.771 |
| Gastric fistula (PEG) | 6.4% | (9) | 2.2% | (2) | 0.209 |
| Regular texture diet (including therapeutic diet) | 50.7% | (71) | 46.7% | (42) | 0.590 |
| Oral supplementation (including enteral nutrient) | 60.0% | (84) | 63.3% | (57) | 0.678 |
| Dysphagia diet | 35.7% | (50) | 41.1% | (37) | 0.486 |
| Successful group | Non-successful group | P valuea | Univariate analysis | P value | Multivariate analysisb | P value | |
|---|---|---|---|---|---|---|---|
| % (n) | % (n) | HR (95% CI) | HR (95% CI) | ||||
| aFisher’s exact test. bModel included age, sex, CCI score, SGA score, %TEE, TLC, CRP, GNRI score, and PPN. HR: hazard ratio; CI: confidence interval; BMI: body mass index; CCI: Charlson Comorbidity Index; SGA: subjective global assessment; %TEE: the energy fill rate to total energy expenditure; Alb: albumin; TLC: total lymphocyte count; CRP: C-reactive protein; TTR: transthyretin; CONUT: controlling nutritional status; PNI: Onodera’s prognostic nutritional index; GNRI: geriatric nutritional risk index; PPN: peripheral parental nutrition. | |||||||
| Age (years) | |||||||
| < 85 | 49.3% (69) | 53.3% (48) | 0.590 | 1 | 0.285 | 1 | 0.368 |
| ≥ 85 | 50.7% (71) | 46.7% (42) | 0.80 (0.52 - 1.21) | 0.81 (0.51 - 1.29) | |||
| Sex | |||||||
| Women | 65.0% (91) | 48.9% (44) | 0.020 | 1 | 0.173 | 1 | 0.812 |
| Men | 35.0% (49) | 51.1% (46) | 1.34 (0.88 - 2.03) | 1.06 (0.66 - 1.71) | |||
| BMI (kg/m2) | |||||||
| ≥ 18.5 | 51.8% (71) | 49.4% (42) | 0.783 | 1 | 0.332 | ||
| < 18.5 | 48.2% (66) | 50.6% (43) | 1.24 (0.81 - 1.90) | ||||
| CCI (points) | |||||||
| < 2 | 26.4% (37) | 22.2% (20) | 0.533 | 1 | 0.627 | 1 | 0.937 |
| ≥ 2 | 73.6% (103) | 77.8% (70) | 1.13 (0.69 - 1.86) | 1.02 (0.59 - 1.77) | |||
| SGA score (points) | |||||||
| < 3 | 43.9% (58) | 29.1% (25) | 0.032 | 1 | 0.062 | 1 | 0.259 |
| ≥ 3 | 56.1% (74) | 70.9% (61) | 1.56 (0.98 - 2.49) | 1.34 (0.81 - 2.20) | |||
| %TEE (%) | |||||||
| ≥ 66.0 | 50.0% (70) | 32.2% (29) | 0.010 | 1 | 0.009 | 1 | 0.061 |
| < 66.0 | 50.0% (70) | 67.8% (61) | 1.82 (1.16 - 2.83) | 1.61 (0.98 - 2.66) | |||
| Alb level (g/dL) | |||||||
| ≥ 2.4 | 57.9% (81) | 37.8% (34) | 0.004 | 1 | 0.015 | ||
| < 2.4 | 42.1% (59) | 62.2% (56) | 1.70 (1.11 - 2.61) | ||||
| TLC level (/µL) | |||||||
| ≥ 1,195 | 45.6% (62) | 44.2% (38) | 0.890 | 1 | 0.513 | 1 | 0.642 |
| < 1,195 | 54.4% (74) | 55.8% (48) | 1.15 (0.75 - 1.77) | 0.89 (0.55 - 1.45) | |||
| CRP level (mg/dL) | |||||||
| < 2.00 | 46.8% (65) | 28.9% (26) | 0.009 | 1 | 0.013 | 1 | 0.103 |
| ≥ 2.00 | 53.2% (74) | 71.1% (64) | 1.79 (1.13 - 2.83) | 1.55 (0.92 - 2.62) | |||
| TTR level (mg/dL) | |||||||
| ≥ 8.5 | 69.9% (79) | 48.5% (33) | 0.005 | 1 | 0.006 | ||
| < 8.5 | 30.1% (34) | 51.5% (35) | 1.97 (1.22 - 3.19) | ||||
| CONUT score | |||||||
| ≤ 7 | 41.8% (51) | 36.8% (28) | 0.551 | 1 | 0.414 | ||
| ≥ 8 | 58.2% (71) | 63.2% (48) | 1.22 (0.76 - 1.94) | ||||
| PNI score | |||||||
| ≥ 33.0 | 32.4% (44) | 23.3% (20) | 0.172 | 1 | 0.063 | ||
| < 33.0 | 67.6% (92) | 76.7% (66) | 1.61 (0.98 - 2.67) | ||||
| GNRI score | |||||||
| ≥ 70.0 | 57.0% (77) | 38.8% (33) | 0.012 | 1 | 0.009 | 1 | 0.099 |
| < 70.0 | 43.0% (58) | 61.2% (52) | 1.80 (1.16 - 2.79) | 1.54 (0.92 - 2.56) | |||
| PPN | |||||||
| Absence | 67.9% (95) | 52.2% (47) | 0.019 | 1 | 0.004 | 1 | 0.014 |
| Presence | 32.1% (45) | 47.8% (43) | 1.86 (1.22 - 2.84) | 1.80 (1.13 - 2.88) | |||