Journal of Clinical Medicine Research, ISSN 1918-3003 print, 1918-3011 online, Open Access
Article copyright, the authors; Journal compilation copyright, J Clin Med Res and Elmer Press Inc
Journal website http://www.jocmr.org

Original Article

Volume 11, Number 2, February 2019, pages 137-144


Factors Influencing the Results in Matrix-Associated Autologous Chondrocyte Implantation: A 2 - 5 Year Follow-Up Study

Figures

Figure 1.
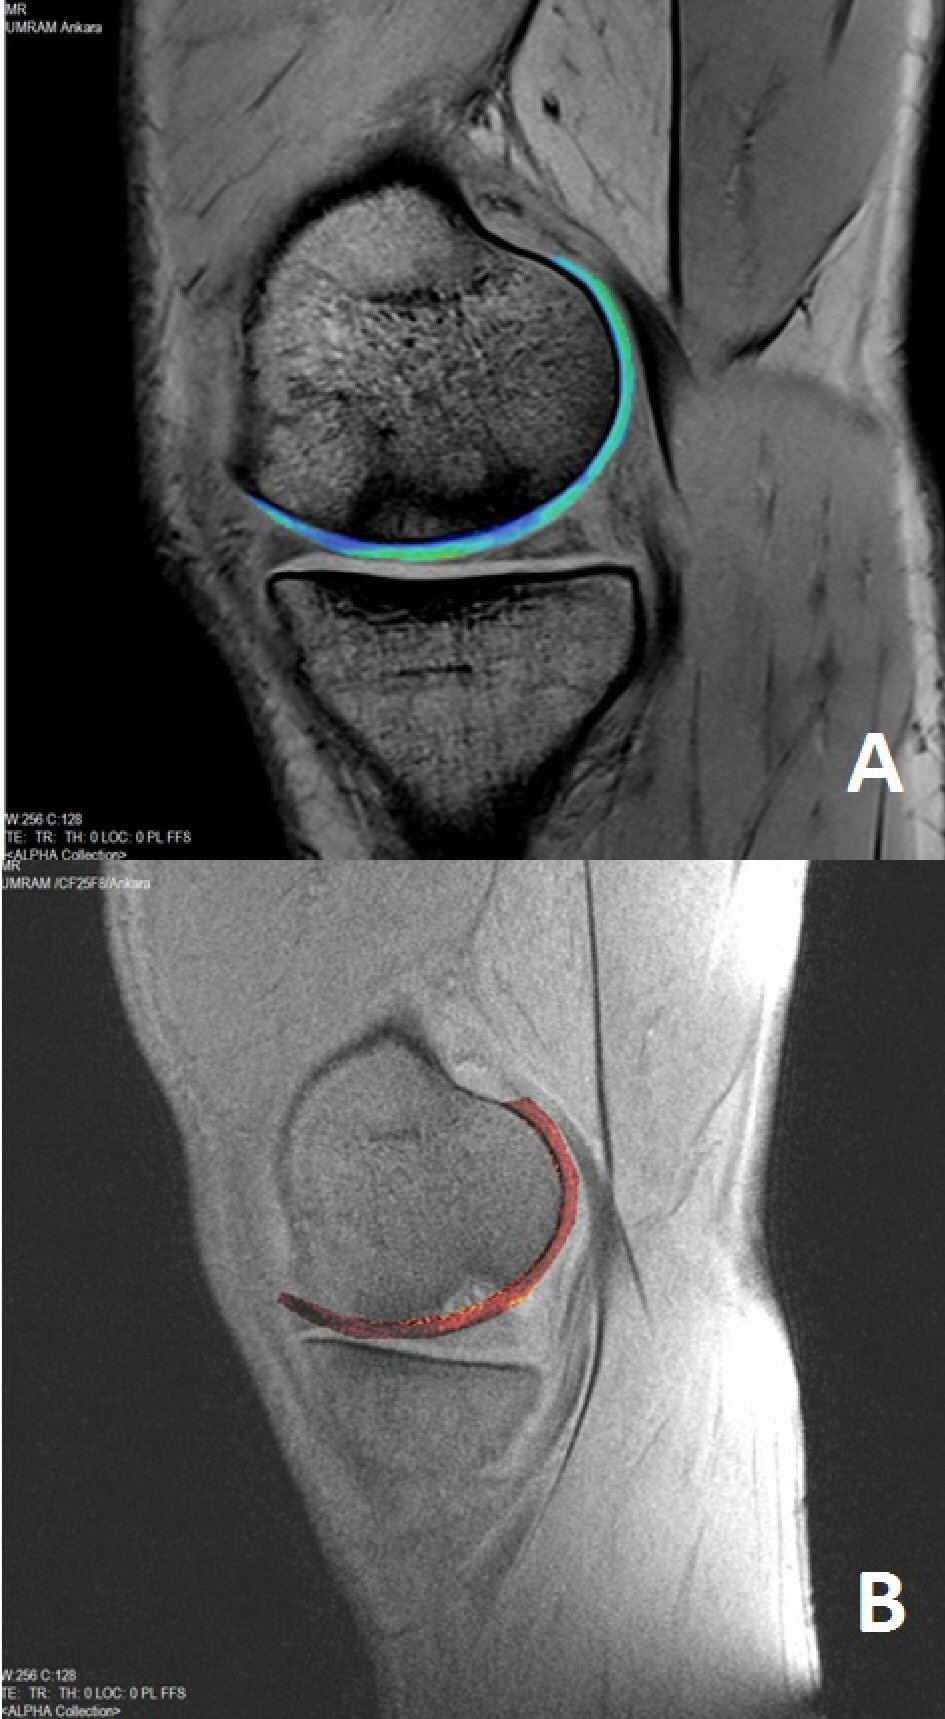
Figure 1. Pre-operative MRI. All patients were evaluated using 3 tesla MRI machine (Trio, Siemens, Erlangen, Germany) and 15-channel transmit-receive birdcage knee coil. Sagittal planes two-dimensional (2D) T1 weighted (W) turbo spin-echo (TSE), 2D T2W gradient-echo (GRE), three-dimensional (3D) proton density W (3D-PDW), 3D short tau inversion recovery (3D-STIR), 3D volume-interpolated breath-hold examination (3D-VIBE), 3D-T2* mapping (A) and postcontrast 3D-T1 dGEMRIC (B) images were obtained. Radiological features of the defect included areas were thicker than native cartilage, rich in water, glycosaminoglycan content decreased and the adjacent bone had an apparent edema on 3T MRI images especially on 3D T1 and T2 mapping images.
Figure 2.
Figure 2. Arthroscopic images. Diagnostic arthroscopy image of the lesion in MFC (A) and indication of the lamination finding at the lesion continuation by the help of the probe (B).
Figure 3.
Figure 3. The second session intraoperative images. Image of the lesion in MFC following the debridement (A) and the image after MACI® application (B).
Figure 4.
Figure 4. The change graphs of the Lysholm and Cincinnati scoring systems according to the existence of concomitant pathology.

Tables

Table 1. Demographic Distribution of the Data
 
NumberMean ± SDMinimumMaximum
SD: standard deviation; BMI: body mass index.
Follow up duration (months)3422.8 ± 11.110.256.8
Age (year)3430.4 ± 9.31848
BMI (kg/m2)3425.2 ± 2.62030
Lesion size (cm2)345.4 ± 1.43.28.0


Table 2. Demographic Distribution of Data
 
Number%
OCD: osteochondritis dissecans.
Concomitant pathologies
  Isolated1955.9
  Front cruciate ligament reconstruction823.5
  Anterograde drilling12.9
  Femoral corrective osteotomy12.9
  Meniscal scaffold12.9
  Meniscal transplantation25.9
  Meniscus repair25.9
Lesion number
  13191.2
  238.8
Acute/chronic/OCD
  Acute38.8
  Chronic2367.6
  OCD823.5
Traumatic/degenerative
  Degenerative1029.4
  OCD823.5
  Traumatic1647.1


Table 3. Time Distribution of the Lysholm Functional Scoring Method
 
NumberMean ± SDMedianMinimumMaximum
SD: standard deviation.
Pre-Surgery Lysholm3437.2 ± 10.1401850
6th month Lysholm3473.9 ± 8.0764585
12th month Lysholm3480.6 ± 8.9824594
24th month Lysholm1884.9 ± 4.5867490
36th month Lysholm986.1 ± 4.2887791
48th month Lysholm287.5 ± 0.7878788
60th month Lysholm190909090


Table 4. Time Distribution of the Cincinnati Functional Scoring Method
 
NumberMean ± SDMedianMinimumMaximum
SD: standard deviation.
Pre-surgery Cincinnati3437.7 ± 9.0392056
Follow-up 6th month Cincinnati3474.4 ± 8.3744487
Follow-up 12th month Cincinnati3480.9 ± 9.4814495
Follow-up 24th month Cincinnati1885.8 ± 4.9887292
Follow-up 36th month Cincinnati986.8 ± 4.5887692
Follow-up 48th month Cincinnati289.0 ± 1.4898890
Follow-up 60th month Cincinnati191919191


Table 5. Tablo 5. Time Distribution of the Functional Scoring Methods and the Results of the Comparison
 
NumberLysholmCincinnati
Mean ± SDP valueMean ± SDP value
The dependent group t-test and repetitive measure variance analysis were used. SD: standard deviation; Ref.: reference.
Pre-surgery3437.2 ± 10.1Ref.37.7 ± 9.0Ref.
Follow-up 6th month3473.9 ± 8.00.000174.4 ± 8.30.0001
Follow-up 12th month3480.6 ± 8.90.000180.9 ± 9.40.0001
Follow-up 24th month1884.9 ± 4.50.000185.8 ± 4.90.0001


Table 6. The Change Distributions of Lysholm Measures According to Time With Reference to Gender
 
FemaleMale
NMean ± SDMed (Min - Max)NMean ± SDMed (Min - Max)
SD: standard deviation; N: number; Med: median; Min: minimum; Max: maximum.
Pre-surgery Lysholm434.5 ± 19.936(18 - 48)3037.5 ± 9.740(20 - 50)
Follow-up 6th month Lysholm474.5 ± 9.975(64 - 84)3073.8 ± 7.976(45 - 85)
Follow-up 12th month Lysholm481.2 ± 8.582(70 - 90)3080.4 ± 9.182(45 - 94)
Follow-up 24th month Lysholm174741785.6 ± 3.686(80 - 90)
Follow-up 36th month Lysholm17777887.2 ± 2.788(84 - 91)


Table 7. The Change Distributions of Cincinnati Measures According to Time With Reference to Gender
 
FemaleMale
NMean ± SDMed (Min - Max)NMean ± SDMed (Min - Max)
SD: standard deviation; N: number; Med: median; Min: minimum; Max: maximum.
Pre-surgery Cincinnati434.2 ±11.335(20 - 46)3038.2 ± 8.739(23 - 56)
Follow-up 6th month Cincinnati476.5 ±7.576(70 - 83)3074.1 ± 8.574(44 - 87)
Follow-up 12th month Cincinnati482.0 ±7.982(72 - 91)3080.8 ± 9.781(44 - 95)
Follow-up 24th month Cincinnati172721786.6 ± 3.788(78 - 92)
Follow-up 36th month Cincinnati10.7676888.1 ± 2.288(86 - 92)


Table 8. Result of Comparisons of Lysholm and Cincinnati Measures at Pre- and Post-Operative Distributions With Reference to BMI Groups
 
LysholmCincinnati
BMI ≤ 25BMI > 25P valueBMI ≤ 25BMI > 25P value
Mean ± SDMean ± SDMean ± SDMean ± SD
Repetitive measure variance analysis was used. SD: standard deviation; Med: median; Min: minimum; Max: maximum; BMI: body mass index.
Pre-surgery37.1±9.437.3 ± 11.20.94138.2 ± 7.938.2 ± 7.90.779
Follow-up 6th month74.0 ± 9.273.7 ± 6.674.1 ± 9.974.1 ± 9.9
Follow-up 12th month80.8 ± 10.980.2 ± 6.281.0 ± 11.681.0 ± 11.6
Follow-up 24th month85.5 ± 3.884.5 ± 5.186.1 ± 4.486.1 ± 4.4


Table 9. Distribution of Lysholm Measures According to the Existence of Concomitant Pathology
 
No Pathology (n = 19)Pathology (n = 15)P value
NMean ± SDMed (Min - Max)NMean ± SDMed (Min - Max)
Student’s t-test was used. SD: standard deviation; N: number; Med: median; Min: minimum; Max: maximum.
Pre-surgery Lysholm1940.0 ± 8.742 (20 - 50)1533.4 ± 11.030 (18 - 50)0.091
Follow-up 6th month Lysholm1977.3 ± 5.679 (66 - 85)1569.3 ± 8.769 (45 - 84)0.004
Follow-up 12th month Lysholm1984.9 ± 5.286 (74 - 94)1574.6 ± 9.777 (45 - 84)0.0001
Follow-up 24th month Lysholm1086.4 ± 3.587 (80 - 90)883.1 ± 5.183 (74 - 90)0.173
Follow-up 36th month Lysholm486.8 ± 2.886 (84 - 90)585.6 ± 5.488 (77 - 91)0.905


Table 10. Distribution of Cincinnati Measures According to the Existence of Concomitant Pathology
 
No pathology (n = 19)Pathology (n = 15)P value
NMean ± SDMed (Min - Max)NMean ± SDMed (Min - Max)
SD: standard deviation; N: number; Med: median; Min: minimum; Max: maximum.
Pre-surgery Cincinnati1940.1 ± 7.341 (23 - 50)1534.5 ± 10.233 (20 - 56)0.051
Follow-up 6th month Cincinnati1977.5 ± 6.080 (66 - 87)1570.1 ± 9.370 (44 - 86)0.012
Follow-up 12th month Cincinnati1985.7 ± 5.487 (74 - 95)1574.4 ± 9.978 (44 - 85)0.0001
Follow-up 24th month Cincinnati1087.5 ± 3.588 (81 - 92)883.8 ± 6.086 (72 - 89)0.122
Follow-up 36th month Cincinnati488.0 ± 2.887 (86 - 92)585.8 ± 5.788 (76 - 90)0.905