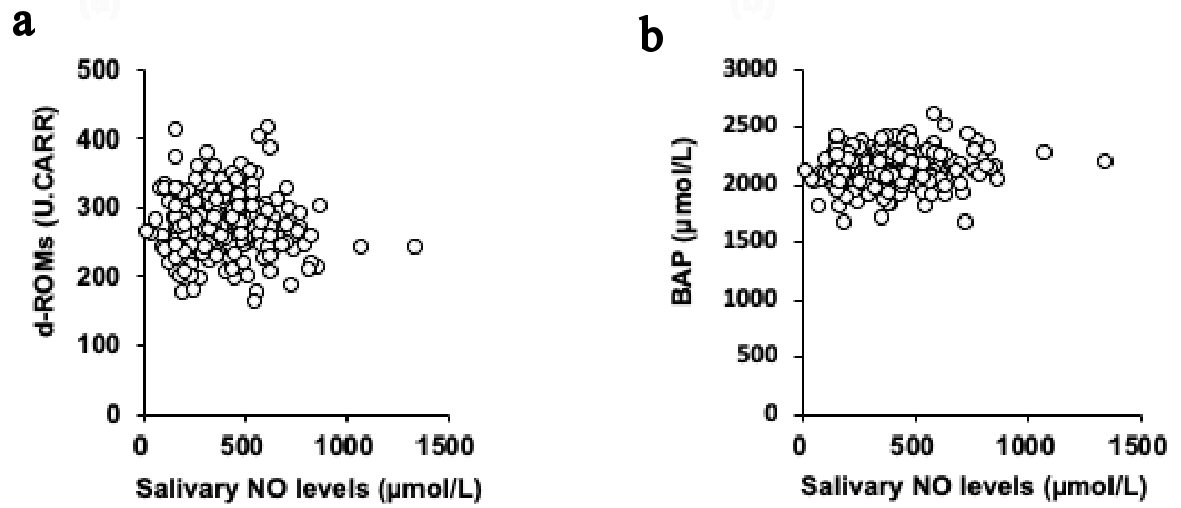
Figure 1. Univariate correlations between the levels of salivary NO and d-ROM (a) and BAP (b). NO: nitric oxide; d-ROM: derived reactive oxygen metabolites; BAP: biological antioxidant potential.
| Journal of Clinical Medicine Research, ISSN 1918-3003 print, 1918-3011 online, Open Access |
| Article copyright, the authors; Journal compilation copyright, J Clin Med Res and Elmer Press Inc |
| Journal website http://www.jocmr.org |
Original Article
Volume 11, Number 2, February 2019, pages 114-120
Assessment of Salivary Nitric Oxide Levels in Elite University Athletes in Japan: Findings From a Cross Sectional Study Design
Figures
Tables
| Variable | Total (n = 250) | Males (n = 151) | Females (n = 99) | P |
|---|---|---|---|---|
| Data are shown as the mean ± SD of the mean. *P < 0.05, versus males. NO: nitric oxide; d-ROM: derived reactive oxygen metabolites; BAP: biological antioxidant potential. | ||||
| Age (years) | 20 ± 1 | 20 ± 1 | 20 ± 1 | 0.53 |
| Experiences (years) | 11 ± 3 | 11 ± 3 | 11 ± 3 | 0.292 |
| Height (cm) | 171 ± 9 | 175 ± 6 | 164 ± 7* | 0.000 |
| Weight (kg) | 66 ± 11 | 71 ± 10 | 59 ± 7* | 0.000 |
| Body mass index (kg/m2) | 22 ± 3 | 22 ± 3 | 22 ± 2* | 0.014 |
| Body fat mass (kg) | 13 ± 14 | 14 ± 18 | 13 ± 5* | 0.000 |
| Skeletal muscle mass (kg) | 31 ± 6 | 34 ± 4 | 26 ± 3* | 0.000 |
| Fat free mass (kg) | 54 ± 10 | 60 ± 8 | 46 ± 6* | 0.000 |
| Percent body fat (%) | 16 ± 6 | 12 ± 4 | 21 ± 4* | 0.000 |
| Salivary NO levels (µmol/L) | 380 ± 198 | 383 ± 210 | 376 ± 179 | 0.821 |
| Salivary flow rate (mL/min) | 0.662 ± 0.273 | 0.647 ± 0.277 | 0.685 ± 0.265 | 0.103 |
| d-ROM test (U.CARR) | 278 ± 43 | 271 ± 42 | 289 ± 42* | 0.001 |
| BAP test (µmol/L) | 2,136 ± 189 | 2,154 ± 143 | 2,108 ± 241* | 0.027 |
| d-ROM / BAP ratio | 7.86 ± 1.34 | 8.13 ± 1.27 | 7.44 ± 1.34* | 0.000 |
| Fatigue scale (mm) | 40 ± 21 | 37 ± 22 | 45 ± 18* | 0.003 |
| Performance scale (mm) | 53 ± 19 | 56 ± 19 | 48 ± 18* | 0.001 |
| Athletic events | Males | Females |
|---|---|---|
| Data are shown as the mean ± SD of the mean and expressed in µmol/L. T: the numbers of total athletes; M: the numbers of male athletes; F: the numbers of female athletes. Athletics including jump, sprint, middle, long and combined. Aquatics include swimming and water polo. | ||
| Football (T = 32; M = 25, F = 7) | 448 ± 48 | 337 ± 73 |
| Handball (T = 25; M = 13, F = 12) | 277 ± 31 | 433 ± 53 |
| Basketball (T = 10; M = 0, F = 10) | No data | 327 ± 49 |
| Volleyball (T = 22; M = 13, F = 9) | 384 ± 65 | 346 ± 59 |
| Athletics (T = 73; M = 47, F = 26) | 400 ± 34 | 379 ± 40 |
| Kendo (T = 18; M = 8, F = 10) | 221 ± 22 | 421 ± 45 |
| Judo (T = 17; M = 12, F = 5) | 355 ± 38 | 276 ± 83 |
| Aquatics (T = 33; M = 23, F = 10) | 448 ± 39 | 406 ± 57 |
| Tennis (T = 10; M = 3, F = 7) | 249 ± 17 | 377 ± 73 |
| Badminton (T = 10; M = 7, F =3) | 312 ± 73 | 370 ± 78 |
| Disease | n = 26 | Current symptoms | Medication | |
|---|---|---|---|---|
| Yes | No | |||
| Non-allergy diseases: anemia, arrhythmia, pneumonia, and gastroenteritis, etc. | ||||
| Asthma | n = 9 | n = 1 | n = 8 | n = 1 |
| Food and Drug | n = 3 | n = 1 | n = 2 | n = 0 |
| Rhinitis | n = 3 | n = 3 | n = 0 | n = 2 |
| Dermatitis | n = 3 | n = 3 | n = 0 | n = 1 |
| Non-allergy diseases | n = 8 | n = 2 | n = 6 | n = 2 |