Journal of Clinical Medicine Research, ISSN 1918-3003 print, 1918-3011 online, Open Access
Article copyright, the authors; Journal compilation copyright, J Clin Med Res and Elmer Press Inc
Journal website http://www.jocmr.org

Original Article

Volume 10, Number 12, December 2018, pages 928-935


Clinical Impact of Hemorheology on Subclinical Myocardial Injury in Patients with Hypertension

Figures

Figure 1.
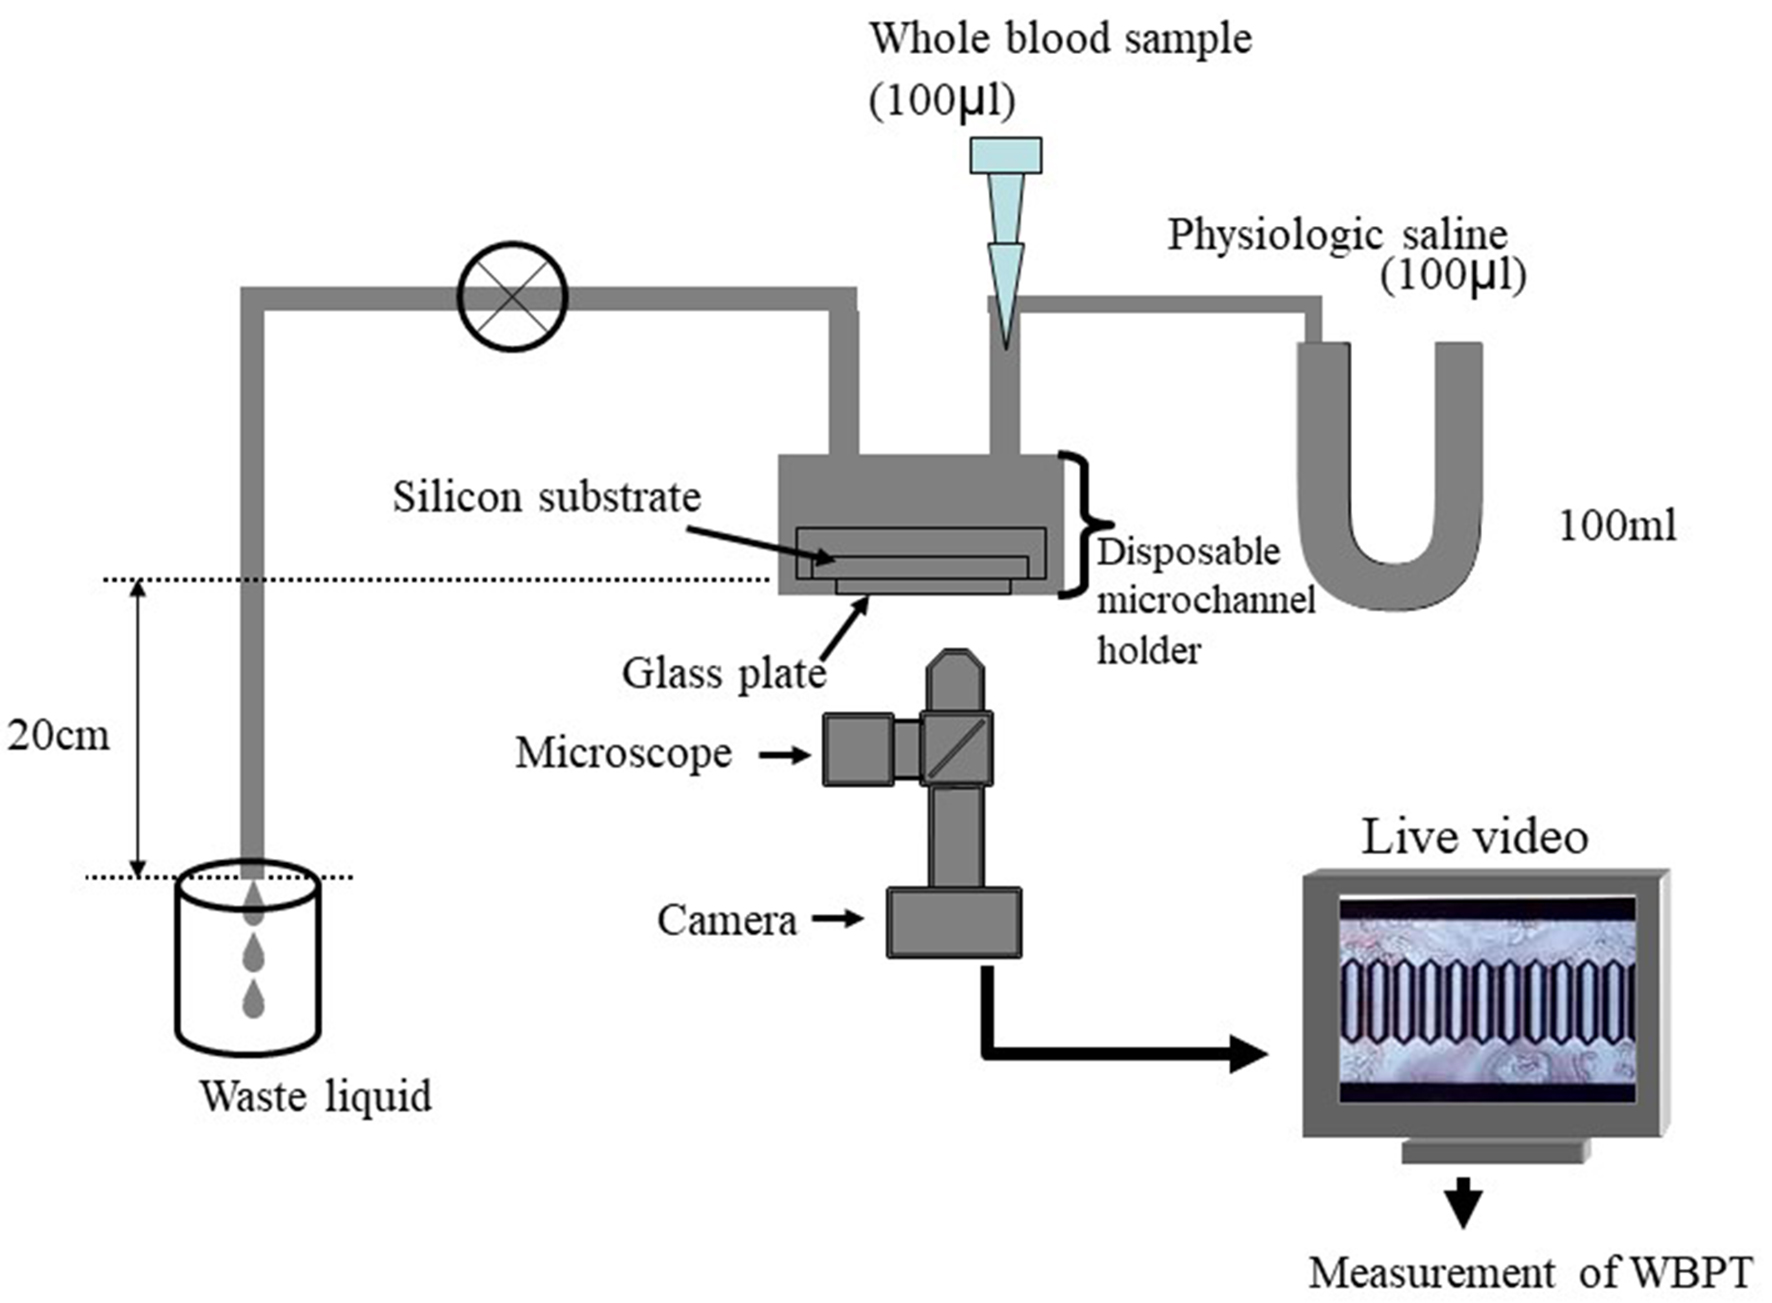
Figure 1. System of microchannel array flow analyzer. The microchannel passage time of 100 µL of physiological saline was measured as a control, and then that of venous whole blood obtained from the subjects with 5% heparinization was determined. The WBPT of the subjects was expressed after correction for the passage time of physiological saline. Inter- and intra-assay coefficients of variation for WBPT were 8% and 5%, respectively. WBPT: whole blood passage time.
Figure 2.
Figure 2. Relationship between hs-cTnT and WBPT. There is significantly positive correlation between log-hs-cTnT and WBPT (r = 0.33, P < 0.001). hs-cTnT: high-sensitivity troponin T; WBPT: whole blood passage time.
Figure 3.
Figure 3. Cutoff value of WBPT for discriminating hs-cTnT levels as ≥ 0.014 ng/mL. Receiver-operating characteristic indicated that a WBPT cutoff of 55.6 s yielded the largest area under the curve, 0.744 (95% confidence interval: 0.699 - 0.784; P < 0.001), indicating a sensitivity of 85.7% and a specificity of 57.0% for discriminating hs-cTnT levels as ≥ 0.014 ng/mL. WBPT: whole blood passage time; hs-cTnT: high-sensitivity troponin T.

Tables

Table 1. Patient Characteristics
 
Overallhs-cTnT non-detectionhs-cTnT detectionP value
Data are expressed as mean ± SD. hs-cTnT: high-sensitivity cardiac troponin T; BP: blood pressure; LDL: low-density lipoprotein; HDL: high-density lipoprotein; FBG: fasting blood glucose; HOMA-IR: homeostatic model assessment of insulin resistance; AF: autofluorescence; eGFR: estimated glomerular filtration rate; BNP: brain natriuretic peptide; d-ROMs: derivatives of reactive oxygen metabolites; CAVI: cardio-ankle vascular index; WBPT: whole blood passage time; CCB: calcium channel blocker; RAS: renin-angiotensin system.
n (male/female)447 (181/266)47 (21/26)400 (160/240)0.535
Age (years)65 ± 1358 ± 1266 ± 12< 0.001
Body mass index (kg/m2)23 ± 423 ± 323 ± 40.541
Exercise habits, n (%)150 (34)16 (34)134 (34)0.941
Current smoker, n (%)118 (26)11 (23)107 (27)0.624
Systolic BP (mm Hg)161 ± 8157 ± 10162 ± 8< 0.01
Diastolic BP (mm Hg)96 ± 994 ± 1096 ± 90.176
Dyslipidemia (%)281 (63)28 (60)253 (63)0.713
Total cholesterol (mg/dL)212 ± 40218 ± 38211 ± 400.173
LDL cholesterol (mg/dL)135 ± 36137 ± 33135 ± 360.553
Triglyceride (mg/dL)128 ± 64131 ± 66128 ± 640.750
HDL cholesterol (mg/dL)52 ± 1555 ± 1551 ± 140.063
Diabetes mellitus (%)174 (39)6 (13)168 (42)< 0.001
FBG (mg/dL)116 ± 24104 ± 20118 ± 24< 0.001
HOMA-IR2.1 ± 1.41.5 ± 1.02.1 ± 1.4< 0.01
SkinAF (AU)2.6 ± 0.62.2 ± 0.62.6 ± 0.5< 0.001
White blood cell (/µL)5,610 ± 1,5855,630 ± 1,3645,608 ± 1,6110.929
Hematocrit (%)39.1 ± 5.539.2 ± 2.339.1 ± 5.80.943
Plate (104/µL)23.8 ± 5.924.2 ± 8.023.8 ± 5.60.636
eGFR (mL/min/1.73 m2)66 ± 2173 ± 1765 ± 22< 0.05
Cornell voltage (mm)15 ± 612 ± 715 ± 5< 0.001
Log-BNP (pg/mL)1.8 ± 0.41.6 ± 0.41.8 ± 0.3< 0.01
d-ROMs test (U. Carr)335 ± 101299 ± 103339 ± 101< 0.01
CAVI9.0 ± 1.48.5 ± 1.29.0 ± 1.4< 0.01
WBPT (s)59.4 ± 16.850.2 ± 14.260.5 ± 16.8< 0.001
log-hs-cTnT (ng/mL)-1.9 ± 0.3--1.9 ± 0.3-
Medication
  CCB, n (%)349 (78)40 (85)309 (77)0.219
  RAS inhibitor, n (%)186 (42)22 (47)164 (41)0.446
  β-blocker, n (%)67 (15)6 (13)61 (15)0.653
  Statin, n (%)147 (33)14 (30)133 (33)0.634
  Anti-diabetic drugs, n (%)133 (30)6 (13)127 (32)< 0.01


Table 2. Correlation Between hs-cTnT, WBPT and Clinical Parameters in hs-cTnT Detectable Patients
 
log-hs-cTnT/rWBPT/r
r: expressed correlation coefficient. *P < 0.05, **P < 0.01, ***P < 0.001. hs-cTnT: high-sensitivity cardiac troponin T; WBPT: whole blood passage time; BP: blood pressure; LDL: low-density lipoprotein; HDL: high-density lipoprotein; FBG: fasting blood glucose; HOMA-IR: homeostatic model assessment of insulin resistance; AF: autofluorescence; eGFR: estimated glomerular filtration rate; BNP: brain natriuretic peptide; d-ROMs: derivatives of reactive oxygen metabolites; CAVI: cardio-ankle vascular index; CCB: calcium channel blocker; RAS: renin-angiotensin system.
Sex (female = 0, male = 1)-0.11*0.05
Age0.27***0.08
Body mass index0.020.11*
Exercise habits (No = 0, Yes = 1)0.08-0.16**
Current smoker (No = 0, Yes = 1)0.100.17**
Systolic BP0.090.06
Diastolic BP0.070.03
Dyslipidemia (No = 0, Yes = 1)0.020.01
Total cholesterol0.090.03
LDL cholesterol0.060.04
Triglyceride0.090.07
HDL cholesterol-0.03-0.02
Diabetes mellitus (No = 0, Yes = 1)0.16**0.11*
FBG0.11*0.10
HOMA-IR0.090.09
Skin AF0.41***0.21***
White blood cell0.080.11*
Hematocrit0.090.18***
Plate0.080.07
eGFR-0.19***-0.14**
Cornell voltage0.15**0.09
log-BNP0.26***0.08
d-ROMs test0.29***0.29***
CAVI0.39***0.37***
CCB (No = 0, Yes = 1)-0.05-0.04
RAS inhibitor (No = 0, Yes = 1)-0.09-0.08
β-blocker (No = 0, Yes = 1)-0.040.03
Statin (No = 0, Yes = 1)-0.07-0.09
Anti-diabetic drugs (No = 0, Yes = 1)-0.09-0.06


Table 3. Multiple Regression Analysis
 
Explanatory factorβP value
(A) Subordinate factor is log-hs-cTnT, R2 = 0.35; (B) subordinate factor is WBPT, R2 = 0.30. AF: autofluorescence; CAVI: cardio-ankle vascular index; WBPT: whole blood passage time; d-ROMs: derivatives of reactive oxygen metabolites; eGFR: estimated glomerular filtration rate; BNP: brain natriuretic peptide; hs-cTnT: high-sensitivity cardiac troponin T.
(A)Skin AF0.27< 0.001
CAVI0.16< 0.01
WBPT0.15< 0.01
Age0.13< 0.01
d-ROMs test0.12< 0.01
eGFR-0.11< 0.01
log-BNP0.10< 0.05
Cornell voltage0.090.068
(B)CAVI0.26< 0.001
log-hs-cTnT0.18< 0.01
d-ROMs test0.17< 0.01
Skin AF0.15< 0.01
Hematocrit0.13< 0.01
Exercise habits-0.12< 0.01
Current smoker0.11< 0.05
eGFR-0.090.057