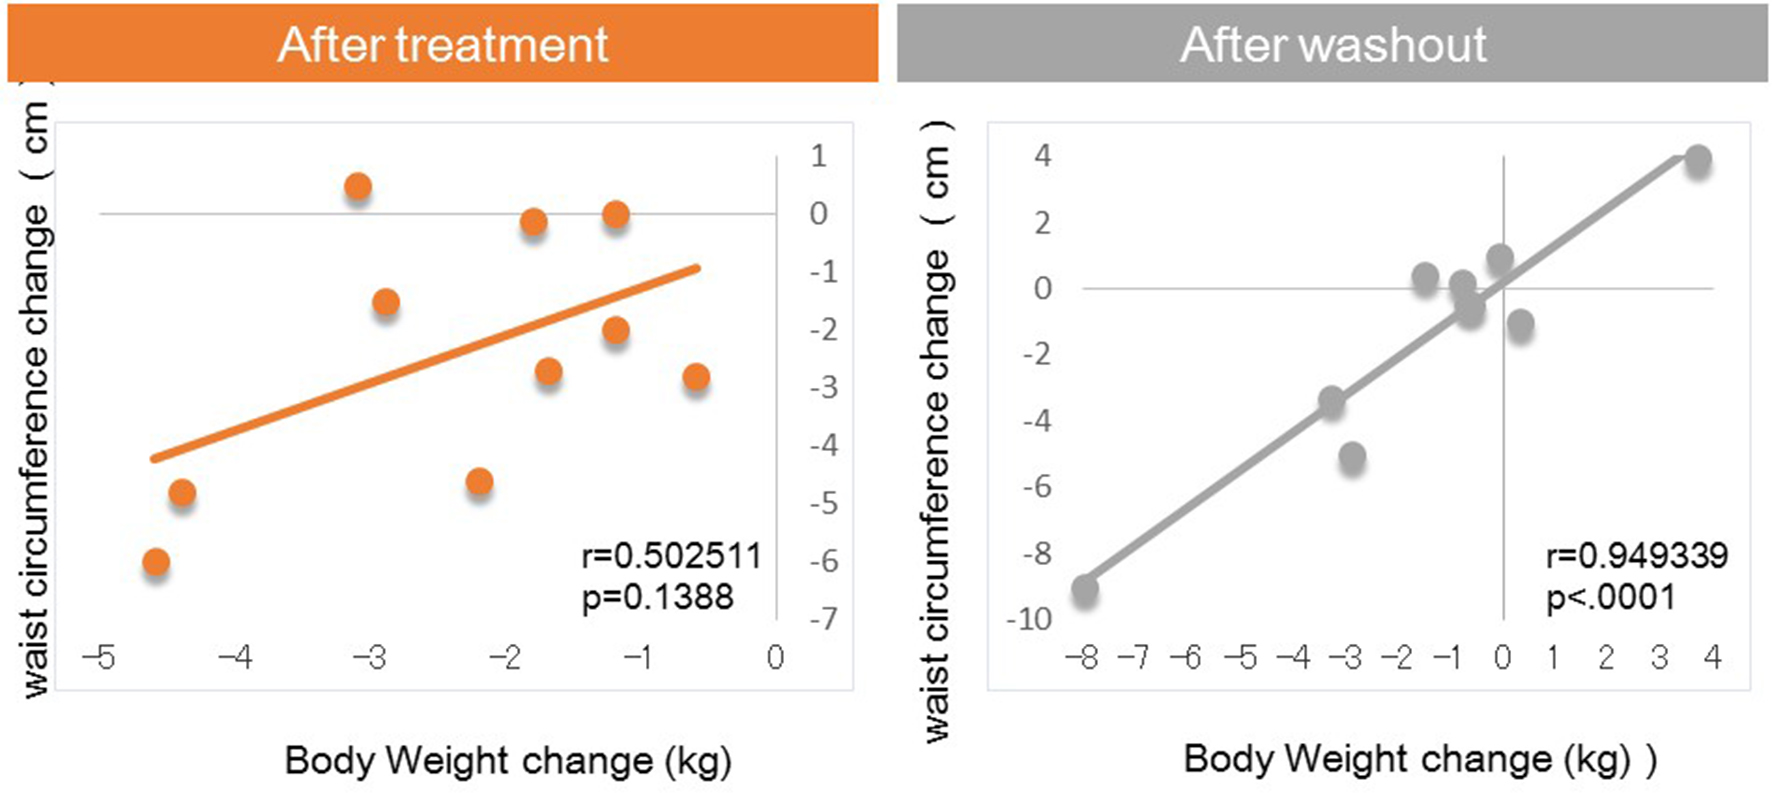
Figure 1. Correlation between body weight changes and waist circumference changes from baseline.
| Journal of Clinical Medicine Research, ISSN 1918-3003 print, 1918-3011 online, Open Access |
| Article copyright, the authors; Journal compilation copyright, J Clin Med Res and Elmer Press Inc |
| Journal website http://www.jocmr.org |
Original Article
Volume 11, Number 1, January 2019, pages 35-41
Residual Effect of Sodium Glucose Cotransporter 2 Inhibitor, Tofogliflozin, on Body Weight After Washout in Japanese Men With Type 2 Diabetes
Figures
Tables
| Data are presented as mean ± SEM. | |
| Number of subjects | 10 |
| Age (years) | 60.9 ± 2.8 |
| HbA1c (%) | 6.8 ± 0.2 |
| Body weight (kg) | 75.4 ± 4.1 |
| BMI (kg/m2) | 26.7 ± 1.1 |
| Waist circumference (cm) | 91.7 ± 3.0 |
| Fasting blood glucose (mg/dL) | 140.8 ± 16.2 |
| Estimated GFR (mL/min/1.73 m2) | 77.3 ± 4.3 |
| Systolic blood pressure (mm Hg) | 139.9 ± 4.5 |
| Diastolic blood pressure (mm Hg) | 83.4 ± 1.9 |
| Presence/absence of antihypertensive agent | 5/5 |
| Presence/absence of use of hyperlipemia treatment agent | 5/5 |
| Presence/absence of use of hyperuricemia treatment agent | 1/9 |
| Baseline | After treatment | After washout | |||
|---|---|---|---|---|---|
| 0 week | 8 weeks | Changes from baseline | 16 weeks | Changes from baseline | |
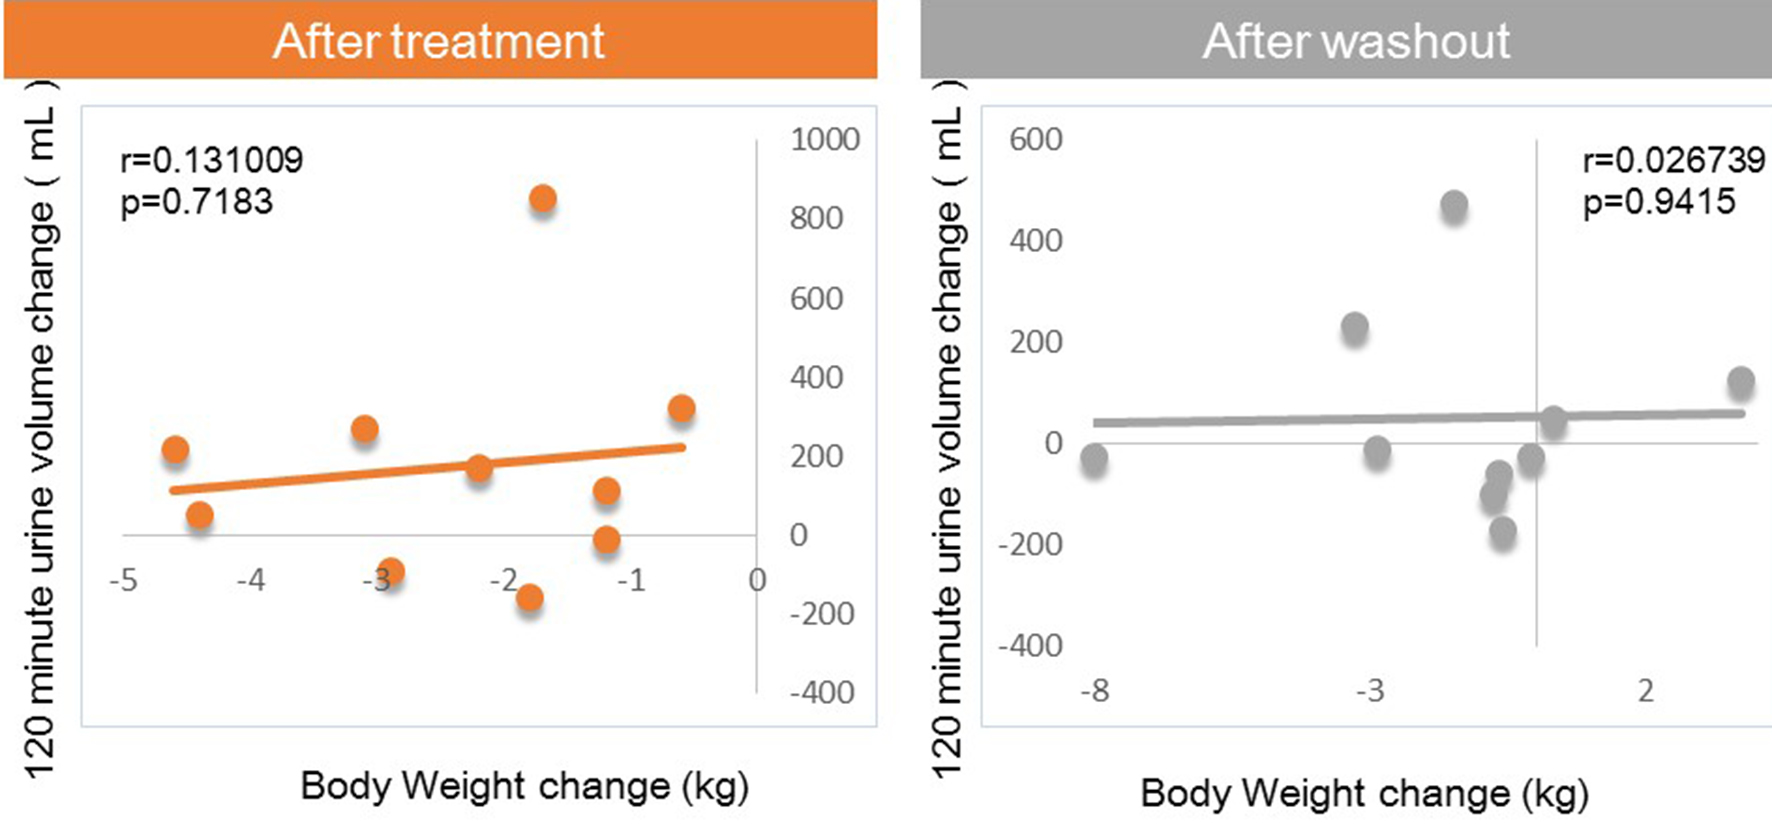
| Data are expressed as mean ± SEM or median (1st, 3rd quartile). *P < 0.05, **P < 0.01, ***P < 0.001 (versus baseline) with paired t-test or Wilcoxon’s signed-rank tests. #Urine was collected during 120 min after loading test meal and volume and glucose content were measured [1]. | |||||
| HbA1c (%) | 6.8 ± 0.2 | 6.5 ± 0.2 | -0.3* | 6.9 ± 0.3 | 0.05 |
| Fasting blood glucose (mg/dL) | 140.8 ± 16.2 | 111.8 ± 7.9 | -29.0 | 124.5 ± 8.8 | -16.3 |
| Body weight (kg) | 75.4 ± 4.1 | 73.0 ± 4.2 | -2.4*** | 74.0 ± 4.7 | -1.4 |
| Waist circumference (cm) | 91.7 ± 3.0 | 89.3 ± 3.0 | -2.4** | 90.3 ± 3.8 | -1.4 |
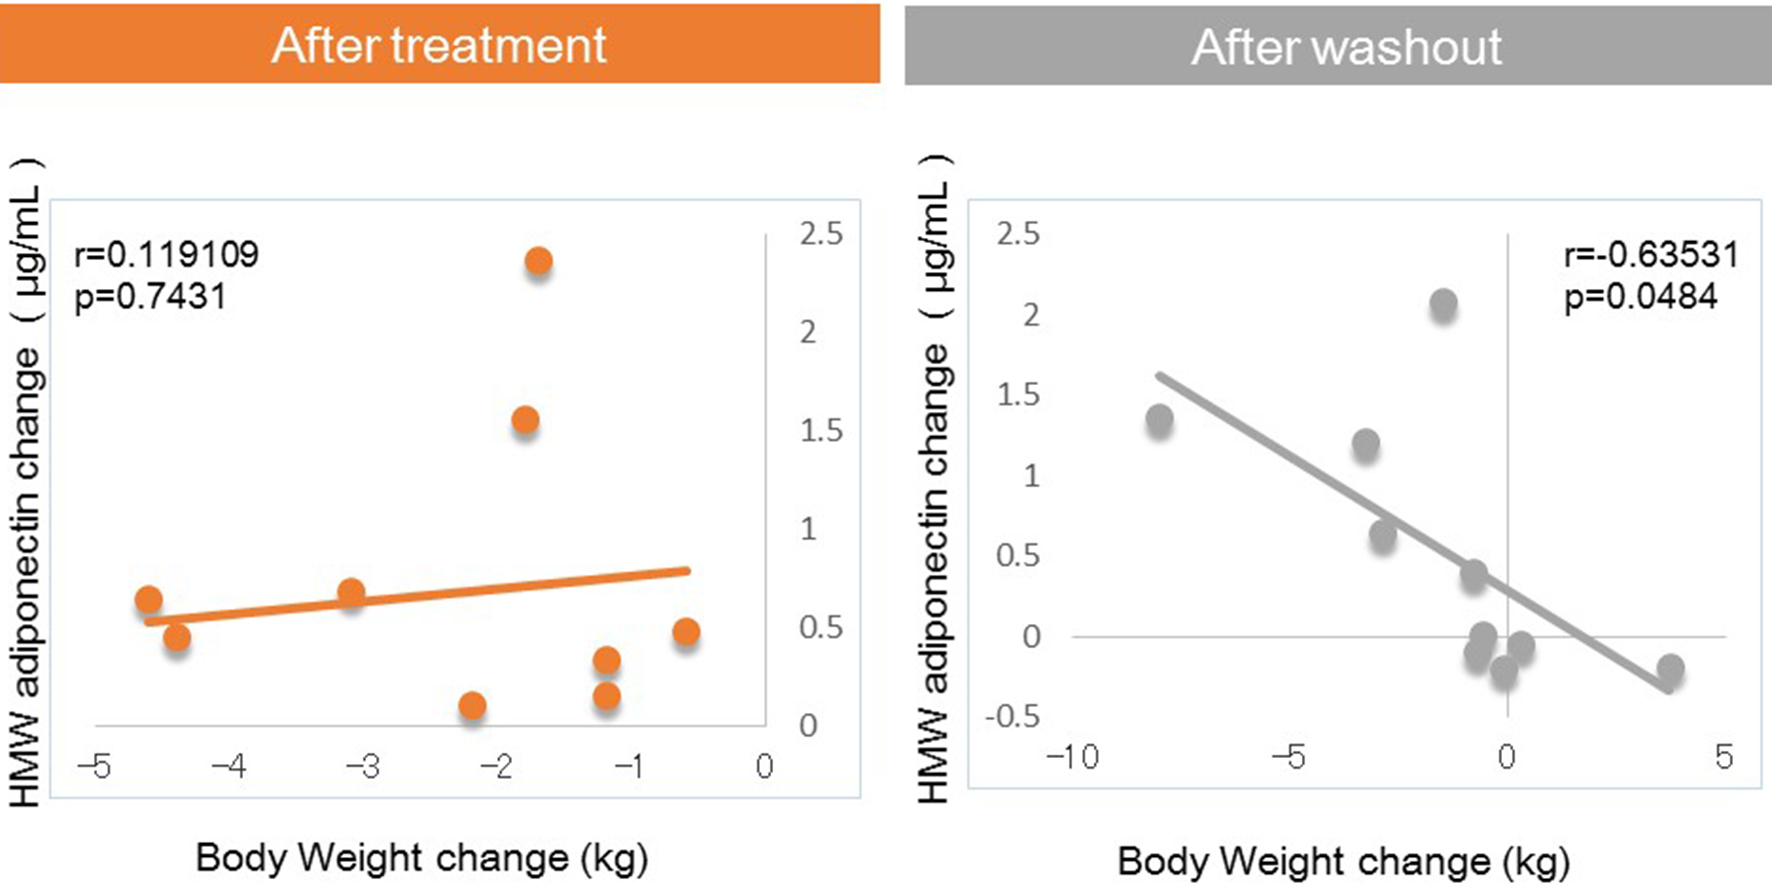
| HMW adiponectin (µg/mL) | 1.98 (1.35, 3.30) | 2.54 (1.56, 4.08) | 0.475*** | 2.66 (1.27, 4.25) | 0.205 |
| Uric acid (mg/dL) | 5.38 ± 0.4 | 4.61 ± 0.4 | -0.77*** | 5.25 ± 0.5 | -0.13 |
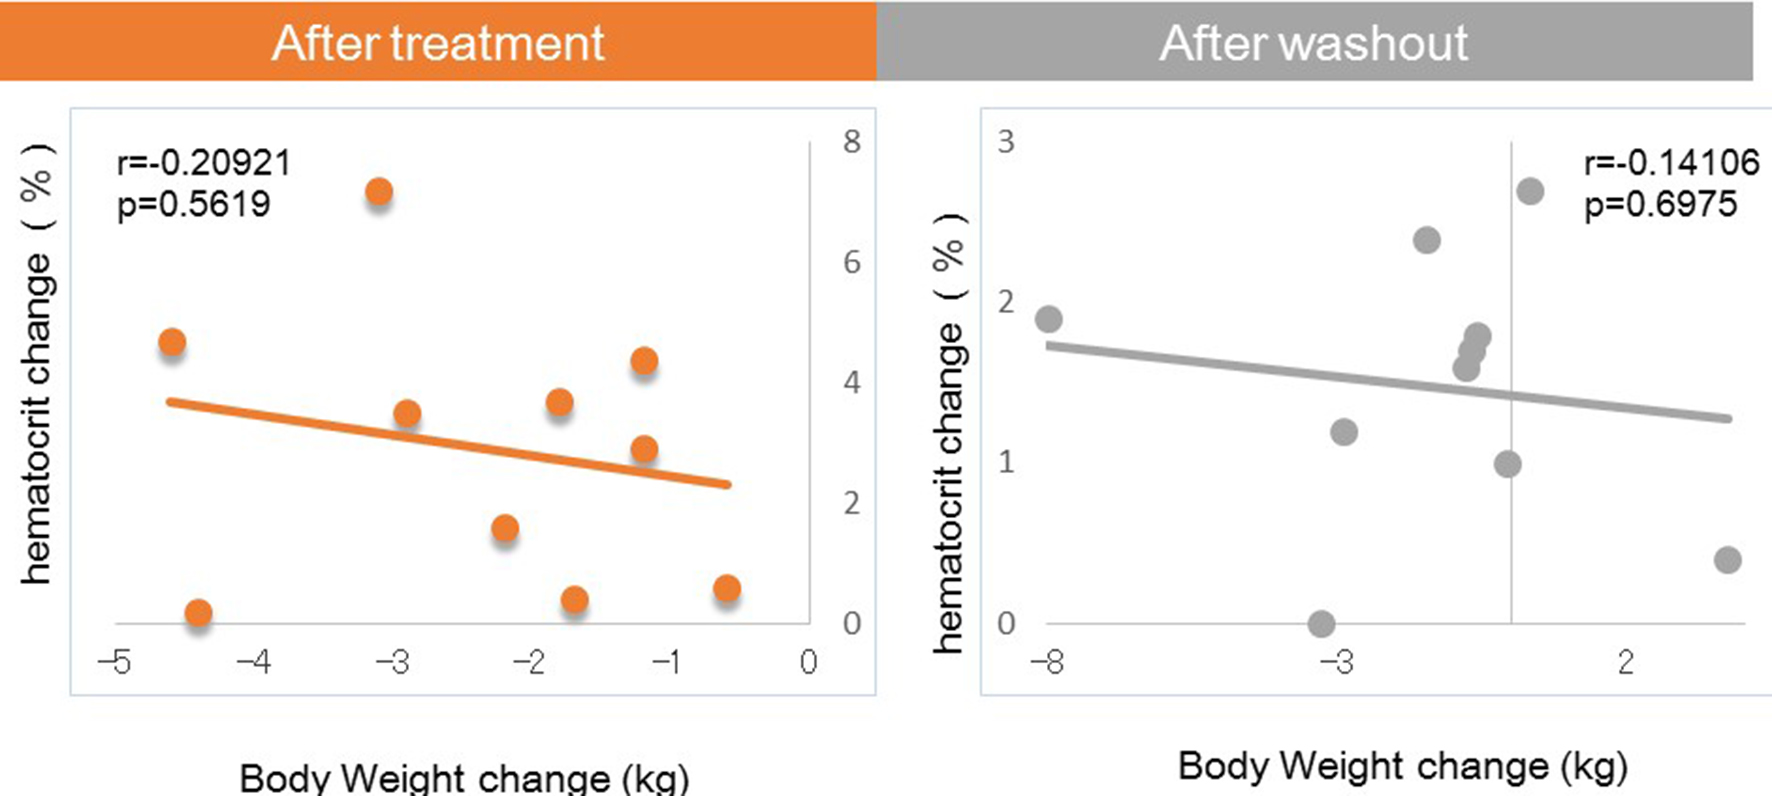
| Ht (%) | 43.92 ± 1.1 | 46.84 ± 0.83 | 2.92*** | 45.39 ± 1.0 | 1.47*** |
| RBC (/µL) | 480.4 ± 13.8 | 510.3 ± 10.28 | 29.9*** | 492.2 ± 11.3 | 11.8* |
| #Urine glucose AUC120 min (g) | 3.8 ± 2.5 | 24.7 ± 4.8 | 20.9** | 1.7 ± 1 | -2.1 |
| #Urine volume AUC120 min (mL) | 224.7 ± 50.2 | 400.4 ± 73.4 | 175.7 | 275.1 ± 98.1 | 50.4 |