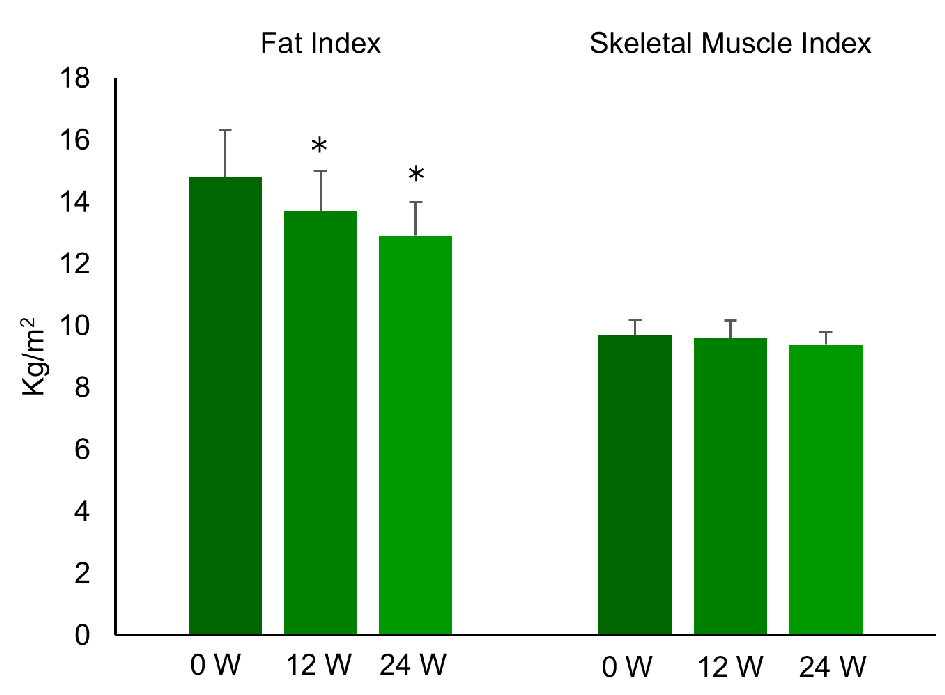
Figure 1. Changes of fat index and skeletal muscle index during the treatment with liraglutide (0.9 mg/day) in obese Japanese patients with type 2 diabetes. *P < 0.05 versus 0 week.
| Journal of Clinical Medicine Research, ISSN 1918-3003 print, 1918-3011 online, Open Access |
| Article copyright, the authors; Journal compilation copyright, J Clin Med Res and Elmer Press Inc |
| Journal website http://www.jocmr.org |
Short Communication
Volume 11, Number 3, March 2019, pages 219-224
Liraglutide Reduces Visceral and Intrahepatic Fat Without Significant Loss of Muscle Mass in Obese Patients With Type 2 Diabetes: A Prospective Case Series
Figures
Tables
| Variable | Baseline (mean ± SD) | 12 weeks (mean ± SD) | P vs. baseline | 24 weeks (mean ± SD) | P vs. baseline |
|---|---|---|---|---|---|
| Age (years) | 44.7 ± 12.2 | ||||
| Gender (men/women) | 4/5 | ||||
| Glucose (mg/dL) | 127 ± 22 | 101 ± 12 | < 0.01 | 101 ± 14 | < 0.05 |
| Insulin (µU/mL) | 11.7 ± 6.4 | 11.9 ± 5.1 | NS | 10.6 ± 5.2 | NS |
| HOMA-IR | 3.5 ± 1.6 | 2.9 ± 1.2 | NS | 2.7 ± 1.4 | NS |
| TG (mg/dL) | 162 ± 60 | 132 ± 57 | NS | 129 ± 42 | < 0.05 |
| HDL-C (mg/dL) | 41.8 ± 4.5 | 40.9 ± 4.7 | NS | 43.1 ± 6.0 | NS |
| LDL-C (mg/dL) | 142 ± 27 | 136 ± 15 | NS | 135 ± 24 | NS |
| HbA1c (%) | 6.4 ± 0.9 | 5.2 ± 0.5 | < 0.01 | 5.2 ± 0.5 | < 0.01 |
| BMI (kg/m2) | 37.4 ± 6.4 | 35.8 ± 5.8 | < 0.05 | 35.0 ± 5.3 | < 0.05 |
| Patient no. | Age | Sex | Baseline FI | FI at 24 weeks | Change from baseline (%) | Baseline SMI | SMI at 24 weeks | Change from baseline (%) | Baseline SMI/FI | SMI/FI at 24 weeks | Change from baseline (%) |
|---|---|---|---|---|---|---|---|---|---|---|---|
| 1 | 31 | M | 14.1 | 12.6 | -10.6 | 12.4 | 11.7 | -5.6 | 0.88 | 0.93 | 5.6 |
| 2 | 57 | F | 13.7 | 12.7 | -7.3 | 8.4 | 8.4 | 0 | 0.61 | 0.66 | 7.9 |
| 3 | 51 | M | 6.6 | 6.3 | -4.5 | 8.8 | 8.6 | -2.3 | 1.33 | 1.37 | 2.4 |
| 4 | 38 | F | 21.1 | 18.9 | -10.4 | 10.5 | 10.1 | -3.8 | 0.49 | 0.53 | 7.4 |
| 5 | 37 | M | 12.8 | 10.9 | -14.8 | 10.6 | 10.1 | -4.7 | 0.83 | 0.93 | 11.9 |
| 6 | 47 | F | 14.9 | 13.6 | -8.7 | 8.8 | 9.1 | 3.4 | 0.59 | 0.67 | 13.3 |
| 7 | 42 | F | 11.9 | 12.4 | 4.2 | 7.2 | 7.4 | 2.8 | 0.61 | 0.6 | -1.4 |
| 8 | 20 | F | 19.8 | 15.8 | -20.2 | 10.1 | 9.1 | -9.9 | 0.51 | 0.58 | 12.9 |
| 9 | 41 | M | 18.1 | 13.1 | -27.6 | 10.1 | 9.9 | -1.9 | 0.56 | 0.76 | 35.4 |
| Patient no. | Age | Sex | Baseline VFV (cm3) | VFV at 24 weeks (cm3) | Change from baseline (%) | Baseline SFV (cm3) | SFV at 24 weeks (cm3) | Change from baseline (%) | Baseline IHL (%) | IHL at 24 weeks (%) | Change from baseline (%) |
|---|---|---|---|---|---|---|---|---|---|---|---|
| 1 | 31 | M | 5,590 | 4,776 | -14.6 | 15,266 | 14,442 | -5.4 | 24.7 | 2.7 | -88.9 |
| 2 | 57 | F | 4,675 | 4,038 | -13.6 | 12,482 | 12,577 | -0.7 | 33.6 | 12.9 | -61.6 |
| 3 | 51 | M | 4,469 | 4,585 | 2.6 | 4,868 | 5,191 | -6.6 | 28.5 | 26.1 | -8.5 |
| 4 | 38 | F | 5,209 | 4,943 | -5.1 | 17,085 | 16,713 | 2.2 | 23.6 | 11.3 | -51.9 |
| 5 | 37 | M | 5,464 | 4,355 | -20.3 | 9,013 | 13,518 | 49.9 | 17.1 | 9.6 | -43.9 |
| 6 | 47 | F | 3,590 | 3,495 | -26.4 | 17,819 | 17,985 | 0.9 | 23.9 | 13.4 | -43.8 |
| 7 | 42 | F | 4,231 | 4,399 | 3.9 | 11,933 | 12,576 | 5.4 | 39.6 | 34.8 | -12.2 |
| 8 | 20 | F | 3,783 | 2,448 | -35.3 | 22,119 | 16,802 | -24.1 | 62.4 | 9.5 | -84.8 |
| 9 | 41 | M | 9,713 | 7,576 | -22.1 | 16,433 | 13,817 | -15.9 | 35.1 | 18.7 | -46.7 |