Journal of Clinical Medicine Research, ISSN 1918-3003 print, 1918-3011 online, Open Access
Article copyright, the authors; Journal compilation copyright, J Clin Med Res and Elmer Press Inc
Journal website http://www.jocmr.org

Original Article

Volume 10, Number 12, December 2018, pages 904-910


Prevalence and Risk Factors of Elevated Liver Enzymes in Japanese Women With Polycystic Ovary Syndrome

Figures

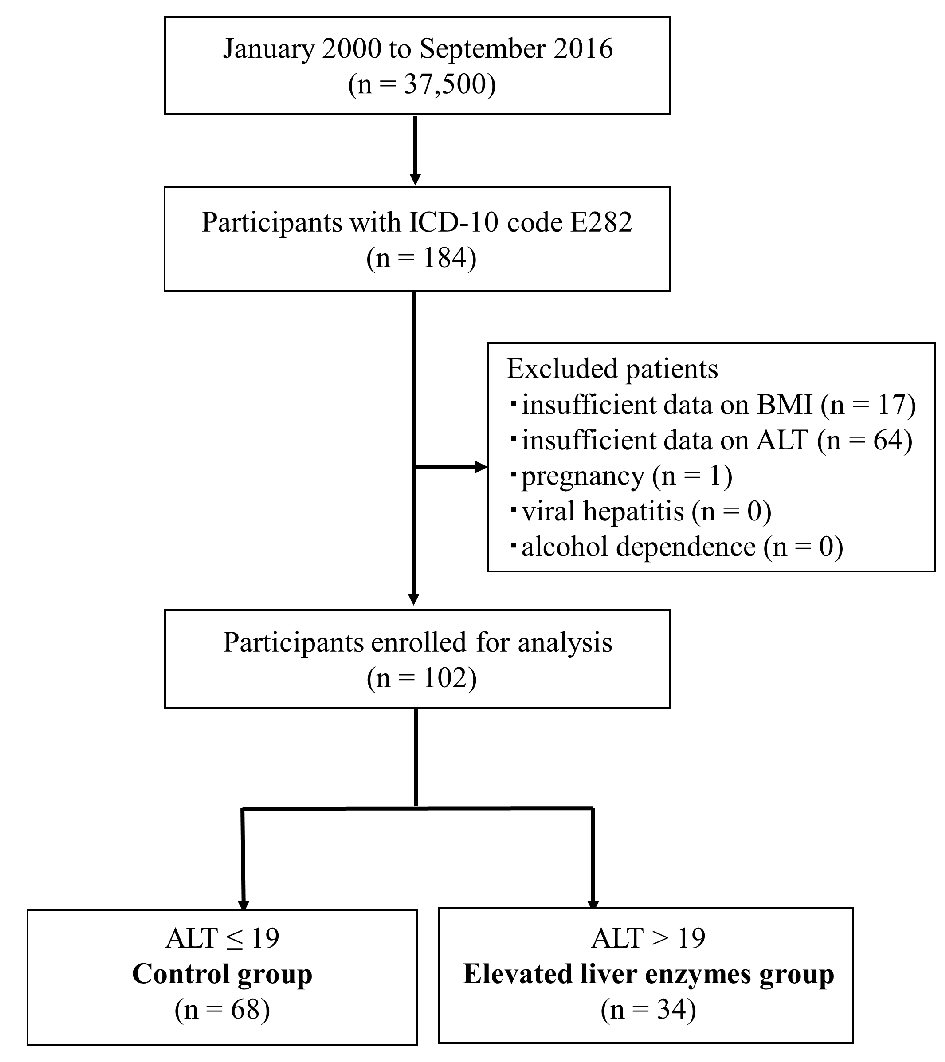
Figure 1.
Figure 1. Inclusion and exclusion flow chart. Flow chart representing the selection of subjects during the retrospective study. Data of 37,500 Japanese women were reviewed, and 184 reproductive-aged women with PCOS were identified using ICD-10 codes. After excluding 82 women (see Materials and Methods section), the remaining subjects were divided into two groups using cutoffs for ALT (19 IU/L). ICD-10: International Classification of Diseased, 10th revision, clinical modification; ALT: alanine amino transferase.
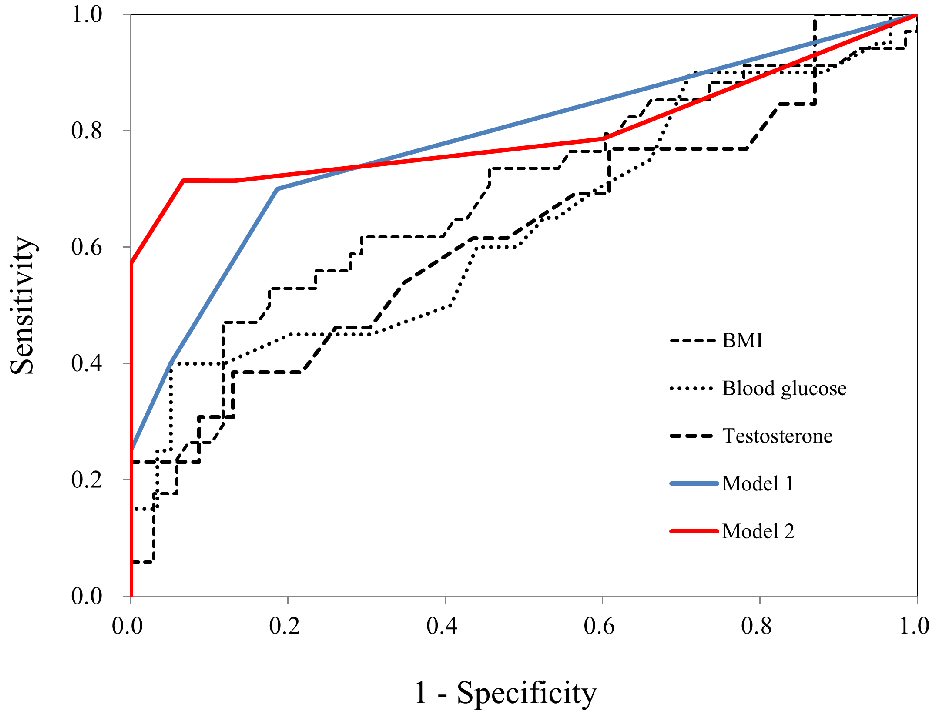
Figure 2.
Figure 2. AUC for the prediction of elevated liver enzymes. ROC curves for BMI, blood glucose, testosterone, Model 1, and Model 2 in women with PCOS. AUC was calculated to assess overall diagnostic accuracy and to identify optimal cutoffs for risk factors for elevated liver enzymes. ROC: receiver-operating characteristics; AUC: area under the receiver-operating characteristics curve.

Tables

Table 1. Anthropometric, Clinical, and Biochemical Characteristics of 102 Patients With PCOS
 
VariablesControl group (N = 68 (66.7%))Elevated liver enzymes group (N = 34 (33.3%))P-value
Reported anthropometric, clinical, and biochemical characteristics of 102 PCOS patients. The normality distribution of the variables was tested using the Kolmogorov-Smirnov test. Differences between the two groups were compared with Student’s t-test for normally distributed data and the Mann-Whitney U-test for nonnormally distributed data. Continuous variables are presented as median (25 - 75 percentiles). *Reported elevated liver enzymes group was significantly different (P < 0.05) than in control group. AST: aspartate aminotransferase; ALT: alanine aminotransferase; ALP: alkaline phosphatase; LDH: lactate dehydrogenase; BUN: blood urea nitrogen; WBC: white blood cell; LH: luteinizing hormone; FSH: follicle stimulation hormone; CRP: C-reactive protein; NLR: neutrophil-to-lymphocyte ratio; PLR: platelet-to-lymphocyte ratio.
Age (years)27.5 (24.0 - 32.0)29.0 (22.8 - 32.0)0.844
BMI (kg/m2)20.7 (18.8 - 23.4)25.3 (20.0 - 29.8)0.003*
AST (IU/L)17.0 (15.0 - 18.0)27.5 (22.8 - 33.0)< 0.001*
ALT (IU/L)12.0 (11.0 - 14.8)32.0 (23.0 - 49.5)< 0.001*
ALP (IU/L)154.5 (135.0 - 190.3)197.0 (158.0 - 266.0)0.001*
LDH (IU/L)147.0 (132.8 - 166.5)170.5 (141.0 - 204.0)0.005*
T-bilirubin (mg/dL)0.7 (0.5 - 0.9)0.7 (0.5 - 0.9)0.606
BUN (mg/dL)12.0 (10.0 - 13.0)11.0 (9.0 - 13.0)0.218
Creatinine (mg/dL)0.6 (0.5 - 0.7)0.6 (0.5 - 0.7)0.462
Blood glucose (mg/dL)90.0 (83.0 - 96.0)93.5 (85.3 - 111.0)0.065
WBC (× 109/L)5.5 (4.5 - 6.6)6.1 (4.6 - 8.4)0.148
Hemoglobin (g/dL)13.2 (12.3 - 13.5)13.0 (12.2 - 14.2)0.692
Platelets (× 109/L)231.5 (200.5 - 294.3)244.0 (207.3 - 277.0)0.821
LH (IU/L)10.1 (7.0 - 16.5)8.4 (4.5 - 11.1)0.087
FSH (IU/L)5.4 (4.7 - 6.8)6.4 (4.6 - 7.6)0.562
Prolactin (IU/L)11.7 (7.0 - 17.2)10.6 (8.5 - 14.5)0.839
Estradiol (nmol/L)39.0 (29.5 - 57.2)34.0 (28.5 - 52.5)0.555
Testosterone (nmol/L)0.3 (0.2 - 0.4)0.4 (0.2 - 0.7)0.106
CRP (mg/dL)0.03 (0.02 - 0.08)0.06 (0.03 - 0.32)0.138
NLR1.61 (1.27 - 2.17)1.75 (1.30 - 3.07)0.258
PLR0.22 (0.17 - 0.25)0.22 (0.19 - 0.30)0.890


Table 2. ROC Analysis of Variables in Predicting Elevated Liver Enzymes in Women With PCOS
 
VariableCutoffAUC95% CISensitivity (%)Specificity (%)PPV (%)NPV (%)PLHNLHDA (%)
Optimal cutoffs for anthropometric, clinical and biochemical measures in 102 patients with PCOS. Sensitivity and specificity were calculated. Two models were set up for predicting elevated liver enzymes using ROC curves to determine clinical references for early diagnosis and prevention. Model 1 included BMI ≥ 25.2 kg/m2 and blood glucose ≥ 103 mg/dL, and Model 2 included BMI ≥ 25.2 kg/m2, blood glucose ≥ 103 mg/dL, and testosterone ≥ 0.550 nmol/L. ROC: receiver-operating characteristics; AUC: area under the receiver-operating characteristics curve; CI: confidence interval; PPV: positive predictive value; NPV: negative predictive value; PLH: positive likelihood ratio; NLH: negative likelihood ratio; DA: diagnostic accuracy; Inf: infinity.
BMI25.20.6810.563 - 0.79852.982.460.077.83.000.5772.5
Blood glucose1030.6390.483 - 0.79440.094.972.782.47.870.6381.0
Testosterone0.5500.6270.422 - 0.83238.587.062.571.42.950.7169.4
Model 17.460.7830.664 - 0.90140.094.972.782.47.870.6381.0
Model 217.70.8610.688 - 0.99966.710010087.0Inf0.3389.7