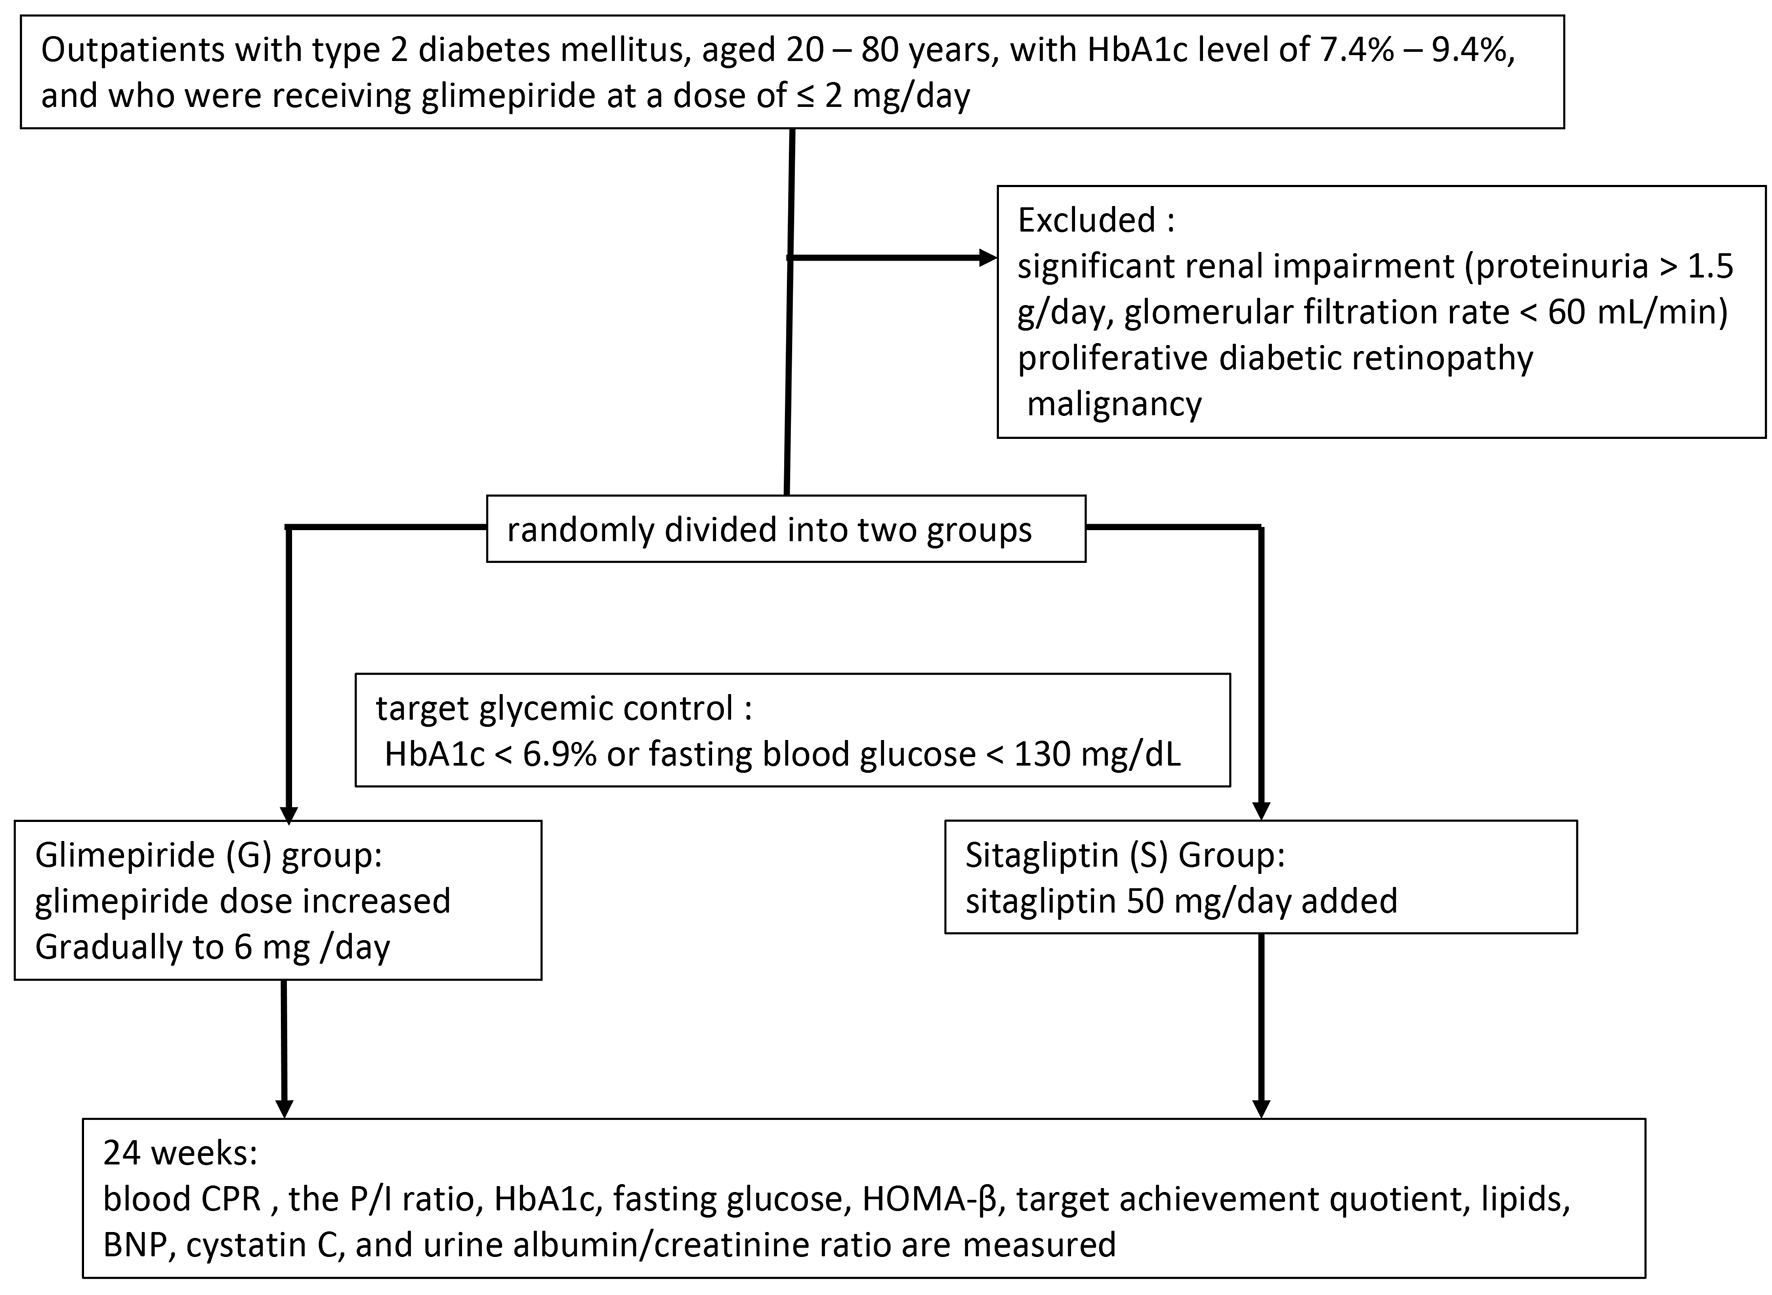
Figure 1. Study protocol.
| Journal of Clinical Medicine Research, ISSN 1918-3003 print, 1918-3011 online, Open Access |
| Article copyright, the authors; Journal compilation copyright, J Clin Med Res and Elmer Press Inc |
| Journal website http://www.jocmr.org |
Original Article
Volume 11, Number 1, January 2019, pages 15-20
Effects of Sitagliptin on Pancreatic Beta-Cells in Type 2 Diabetes With Sulfonylurea Treatment: A Prospective Randomized Study
Figures
Table
| G group (n = 19) | S group (n = 22) | P value | |
|---|---|---|---|
| G group: glimepiride group; S group: sitagliptin group. | |||
| Age (years) | 62.1 ± 9.0 | 63.4 ± 5.9 | 0.940 |
| Disease duration (years) | 11.9 ± 4.9 | 12.9 ± 6.8 | 0.699 |
| Body mass index (kg/m2) | 24.6 ± 3.5 | 24.0 ± 2.4 | 0.432 |
| Systolic blood pressure (mm Hg) | 137 ± 17 | 130 ± 9 | 0.481 |
| Diastolic blood pressure (mm Hg) | 80 ± 8 | 78 ± 9 | 0.207 |
| Fasting blood glucose (mg/dL) | 176 ± 43 | 175 ± 34 | 0.504 |
| Immunoreactive insulin (IU/mL) | 8.9 ± 5.7 | 7.2 ± 4.0 | 0.687 |
| HbA1c (%) | 7.8 ± 0.5 | 8.0 ± 0.6 | 0.423 |
| Urinary albumin (mg/g Cr) | 43.7 ± 76.2 | 33.8 ± 45.2 | 0.852 |
| Total cholesterol (mg/dL) | 209 ± 40 | 202 ± 35 | 0.447 |
| HDL-cholesterol (mg/dL) | 56 ± 14 | 59 ± 19 | 0.339 |
| Triglyceride (mg/dL) | 220 ± 226 | 136 ± 49 | 0.085 |
| Non-HDL-cholesterol (mg/dL) | 153 ± 49 | 143 ± 34 | 0.394 |