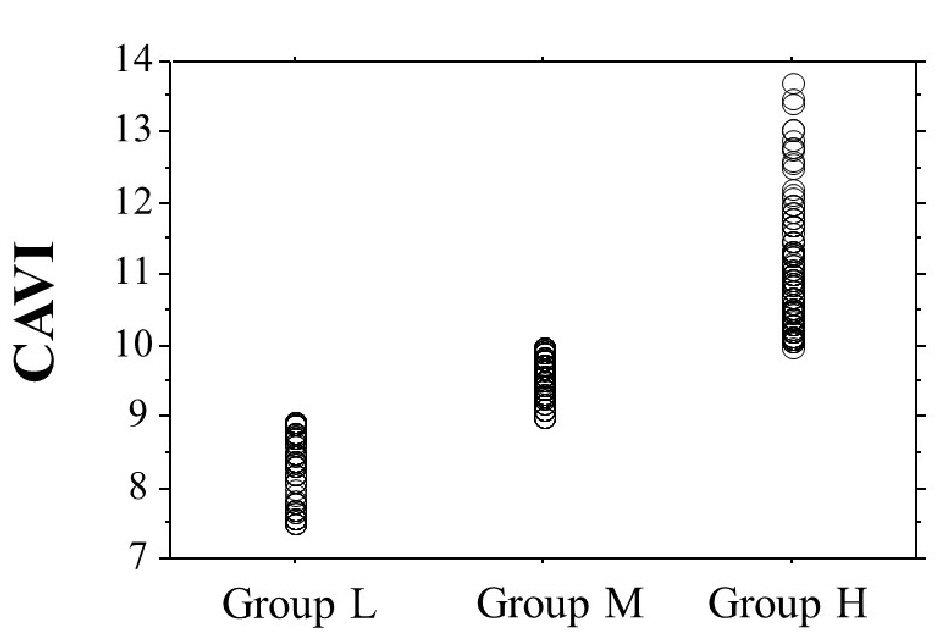
Figure 1. The dot graph of CAVI. CAVI: cardio-ankle vascular index.
| Journal of Clinical Medicine Research, ISSN 1918-3003 print, 1918-3011 online, Open Access |
| Article copyright, the authors; Journal compilation copyright, J Clin Med Res and Elmer Press Inc |
| Journal website http://www.jocmr.org |
Original Article
Volume 10, Number 12, December 2018, pages 883-890
Clinical Usefulness of the Cardio-Ankle Vascular Index as a Predictor of Primary Cardiovascular Events in Patients With Chronic Kidney Disease
Figures
Tables
| Overall | Group L | Group M | Group H | P value | |
|---|---|---|---|---|---|
| Continuous values are mean ± SD. CAVI: cardio-ankle vascular index; SBP: systolic blood pressure; DBP: diastolic blood pressure; eGFR: estimated glomerular filtration rate; LDL: low-density lipoprotein; HDL: high-density lipoprotein; FBG: fasting blood glucose; AF: autofluorescence; d-ROMs: derivatives of reactive oxygen metabolites; U-Alb: urinary albumin; RAS: renin-angiotensin system. *P < 0.001 vs. Group L; **P < 0.01 vs. Group L; ***P < 0.05 vs. Group L; #P < 0.001 vs. Group M; ##P < 0.01 vs. Group M; ###P < 0.05 vs. Group M. | |||||
| n (male/female) | 460 (152/308) | 100 (25/75) | 199 (63/136) | 161 (64/97)*** | < 0.05 |
| Age (yrs) | 74 ± 12 | 71 ± 10 | 73 ± 11 | 75 ± 13** | < 0.05 |
| Risk factors | |||||
| CAVI | 9.7 ± 1.1 | 8.4 ± 0.5 | 9.5 ± 0.2* | 10.9 ± 0.8*# | < 0.001 |
| Obesity, n (%) | 136 (30) | 27 (27) | 56 (28) | 53 (33) | 0.503 |
| Current smoker, n (%) | 79 (17) | 12 (12) | 33 (17) | 34 (21) | 0.159 |
| Hypertension, n (%) | 323 (70) | 65 (65) | 135 (68) | 123 (76) | 0.09 |
| SBP (mm Hg) | 142 ± 16 | 138 ± 17 | 141 ± 16 | 144 ± 13** | < 0.05 |
| DBP (mm Hg) | 87 ± 11 | 85 ± 11 | 88 ± 11*** | 89 ± 11** | < 0.05 |
| Dyslipidemia, n (%) | 320 (70) | 77 (77) | 133 (67) | 110 (68) | 0.181 |
| Diabetes mellitus, n (%) | 155 (34) | 24 (24) | 65 (33) | 66 (41)** | < 0.05 |
| Laboratory findings | |||||
| eGFR (mL/min/1.73m2) | 47 ± 9 | 50 ± 8 | 47 ± 9** | 45 ± 10*### | < 0.001 |
| Total cholesterol (mg/dL) | 216 ± 37 | 217 ± 35 | 214 ± 39 | 218 ± 37 | 0.626 |
| LDL cholesterol (mg/dL) | 129 ± 35 | 130 ± 30 | 126 ± 35 | 133 ± 36 | 0.246 |
| Triglyceride (mg/dL) | 138 ± 63 | 148 ± 72 | 139 ± 62 | 130 ± 57 | 0.073 |
| HDL cholesterol (mg/dL) | 59 ± 15 | 58 ± 14 | 60 ± 15 | 59 ± 15 | 0.462 |
| FBG (mg/dL) | 110 ± 22 | 107 ± 20 | 108 ± 20 | 116 ± 25**## | < 0.001 |
| Skin AF (AU) | 2.7 ± 0.5 | 2.5 ± 0.5 | 2.7 ± 0.5*** | 2.9 ± 0.5*# | < 0.001 |
| d-ROMs test (U.Carr) | 328 ± 86 | 307 ± 88 | 324 ± 82 | 346 ± 88*### | < 0.001 |
| U-Alb (mg/g Cr) | 1.5 ± 0.6 | 1.4 ± 0.5 | 1.5 ± 0.6 | 1.6 ± 0.6*### | < 0.01 |
| Medication | |||||
| RAS inhibitor, n (%) | 164 (36) | 36 (36) | 63 (32) | 65 (40) | 0.229 |
| Statin, n (%) | 158 (34) | 32 (32) | 75 (38) | 51 (32) | 0.421 |
| Anti-diabetic drugs, n (%) | 116 (25) | 20 (20) | 53 (27) | 43 (27) | 0.399 |
| MACE (-) | MACE (+) | P value | |
|---|---|---|---|
| Continuous values are mean ± SD. SBP: systolic blood pressure; DBP: diastolic blood pressure; eGFR: estimated glomerular filtration rate; LDL: low-density lipoprotein; HDL: high-density lipoprotein; FBG: fasting blood glucose; AF: autofluorescence; d-ROMs: derivatives of reactive oxygen metabolites; U-Alb: urinary albumin, RAS: renin-angiotensin system. | |||
| n (male/female) | 363 (121/242) | 97 (31/66) | 0.798 |
| Age (yrs) | 72 ± 11 | 79 ± 11 | < 0.001 |
| Obesity, n (%) | 110 (30) | 26 (27) | 0.503 |
| Current smoker, n (%) | 55 (15) | 24 (25) | < 0.05 |
| Hypertension, n (%) | 241 (66) | 82 (85) | < 0.001 |
| SBP (mm Hg) | 140 ± 15 | 147 ± 16 | < 0.001 |
| DBP (mm Hg) | 87 ± 11 | 89 ± 11 | 0.093 |
| Dyslipidemia, n (%) | 257 (71) | 63 (65) | 0.267 |
| Diabetes mellitus, n (%) | 104 (29) | 51 (53) | < 0.001 |
| eGFR (mL/min/1.73m2) | 48 ± 8 | 43 ± 11 | < 0.001 |
| Total cholesterol (mg/dL) | 216 ± 38 | 217 ± 36 | 0.852 |
| LDL cholesterol (mg/dL) | 129 ± 35 | 130 ± 35 | 0.893 |
| Triglyceride (mg/dL) | 138 ± 63 | 139 ± 62 | 0.927 |
| HDL cholesterol (mg/dL) | 59 ± 15 | 59 ± 14 | 0.939 |
| FBG (mg/dL) | 109 ± 20 | 116 ± 27 | < 0.01 |
| Skin AF (AU) | 2.6 ± 0.5 | 3.0 ± 0.5 | < 0.001 |
| d-ROMs test (U. Carr) | 319 ± 84 | 360 ± 89 | < 0.001 |
| U-Alb (mg/g Cr) | 1.5 ± 0.5 | 1.7 ± 0.7 | < 0.001 |
| RAS inhibitor, n (%) | 143 (39) | 21 (21) | < 0.01 |
| Statin, n (%) | 135 (37) | 23 (24) | < 0.05 |
| Anti-diabetic drug, n (%) | 94 (26) | 22 (23) | 0.518 |
| HR | 95% CI | P value | |
|---|---|---|---|
| HR: hazard ratio; CI: confidence interval; AF: autofluorescence; d-ROMs: derivatives of reactive oxygen metabolites; RAS: renin-angiotensin system; eGFR: estimated glomerular filtration rate. | |||
| Diabetes mellitus | 2.50 | 1.38 - 4.60 | < 0.01 |
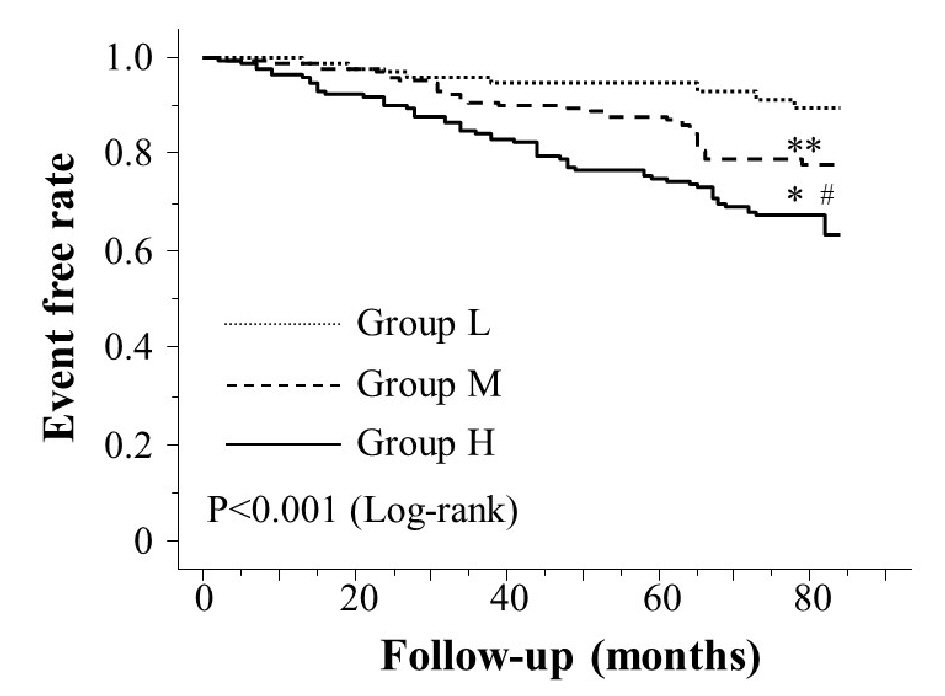
| Group H (vs non-Group H) | 2.04 | 1.31 - 3.02 | < 0.01 |
| Age (≥ 75yrs) | 1.81 | 1.03 - 3.22 | < 0.05 |
| Skin AF (≥ 3.0AU) | 1.64 | 1.09 - 2.63 | < 0.05 |
| d-ROMs test (≥ 330 U. Carr) | 1.61 | 1.01 - 2.79 | < 0.05 |
| RAS inhibitor | 0.58 | 0.23 - 0.99 | < 0.05 |
| Current smoker | 1.58 | 0.93 - 2.69 | 0.089 |
| Albuminuria | 1.39 | 0.92 - 2.11 | 0.137 |
| Statin | 0.70 | 0.42 - 1.15 | 0.178 |
| eGFR (< 30mL/min/1.73m2) | 1.40 | 0.79 - 2.53 | 0.255 |
| Hypertension | 1.26 | 0.73 - 2.16 | 0.399 |