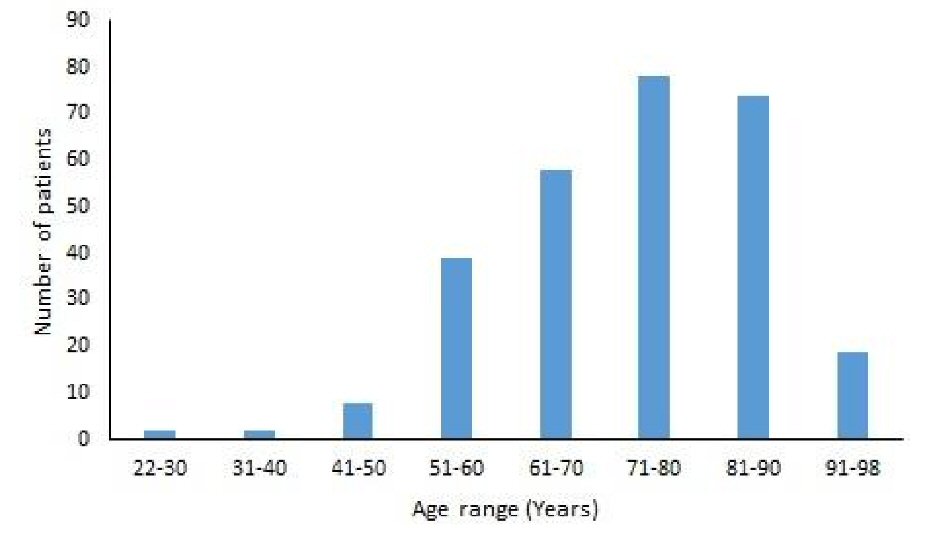
Figure 1. Age distribution of the cancer survivors.
| Journal of Clinical Medicine Research, ISSN 1918-3003 print, 1918-3011 online, Open Access |
| Article copyright, the authors; Journal compilation copyright, J Clin Med Res and Elmer Press Inc |
| Journal website http://www.jocmr.org |
Original Article
Volume 10, Number 12, December 2018, pages 911-919
Comparison of Comorbid Conditions Between Cancer Survivors and Age-Matched Patients Without Cancer
Figures
Tables
| Variable | Group 1 (cancer survivors) (n = 280) | Group 2 (patients without cancer) (n = 280) | P |
|---|---|---|---|
| *Paired t-test. #McNemar test. | |||
| Age mean (SD) | 72.5 (13.1) | 72.5 (12.8) | < 0.938* |
| Gender | |||
| Male (n, %) | 147 (52.5) | 81 (28.9) | < 0.001# |
| Female (n, %) | 133 (47.5) | 199 (71.1) | < 0.001# |
| Race | < 0.001# | ||
| Caucasian (n, %) | 229 (81.8) | 222 (79.3) | < 0.05# |
| African American (n, %) | 28 (10.0) | 36 (12.8) | < 0.05# |
| Hispanic (n, %) | 10 (3.6) | 21 (7.5) | < 0.05# |
| Other (n, %) | 13 (4.6) | 1 (0.4) | < 0.05# |
| Social factors | |||
| Alcohol (n, %) | 158 (56.4) | 152 (54.2) | 0.651# |
| Cigarettes (n, %) | 146 (52.1) | 131 (46.8) | 0.159# |
| Variable | Group 1 (cancer survivors) (n = 280) | Group 2 (patients without cancer) (n = 280) | P* |
|---|---|---|---|
| *McNemar test. | |||
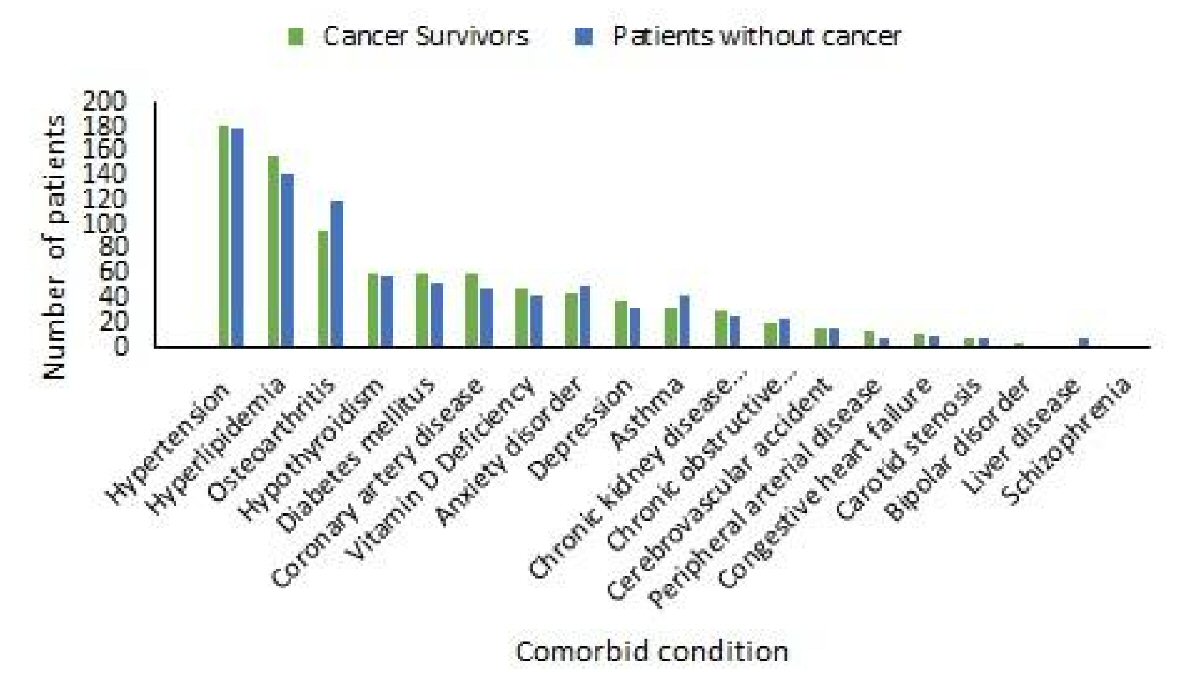
| Hypertension (n, %) | 180 (64.3) | 178 (63.6) | 0.923 |
| Hyperlipidemia (n, %) | 157 (56.1) | 143 (51.1) | 0.258 |
| Osteoarthritis (n, %) | 96 (34.3) | 120 (42.9) | < 0.05 |
| Hypothyroidism (n, %) | 61 (21.8) | 58 (20.7) | 0.918 |
| Diabetes mellitus (n, %) | 61 (21.8) | 53 (18.9) | 0.440 |
| Coronary artery disease (n, %) | 61 (21.8) | 49 (17.5) | 0.230 |
| Vitamin D deficiency (n, %) | 48 (17.1) | 43 (15.4) | 0.653 |
| Anxiety disorder (n, %) | 45 (16.1) | 51 (18.2) | 0.561 |
| Depression (n, %) | 38 (13.6) | 31 (11.1) | 0.450 |
| Asthma (n, %) | 32 (11.4) | 42 (15.0) | 0.268 |
| Chronic kidney disease (n, %) | 30 (10.7) | 26 (9.3) | 0.672 |
| Chronic obstructive airway disease (n, %) | 20 (7.1) | 24 (8.6) | 0.636 |
| Cerebrovascular accident (n, %) | 15 (5.4) | 15 (5.4) | 1.000 |
| Peripheral arterial disease (n, %) | 14 (5.0) | 8 (2.9) | 0.263 |
| Congestive heart failure (n, %) | 12 (4.3) | 10 (3.6) | 0.824 |
| Carotid stenosis (n, %) | 7 (2.5) | 8 (2.9) | 1.000 |
| Bipolar disorder (n, %) | 3 (1.1) | 1 (0.4) | 0.625 |
| Liver disease (n, %) | 2 (0.7) | 8 (2.9) | 0.070 |
| Schizophrenia (n, %) | 1 (0.4) | 1 (0.4) | 1.000 |
| Type of cancer | Frequency (n = 280) |
|---|---|
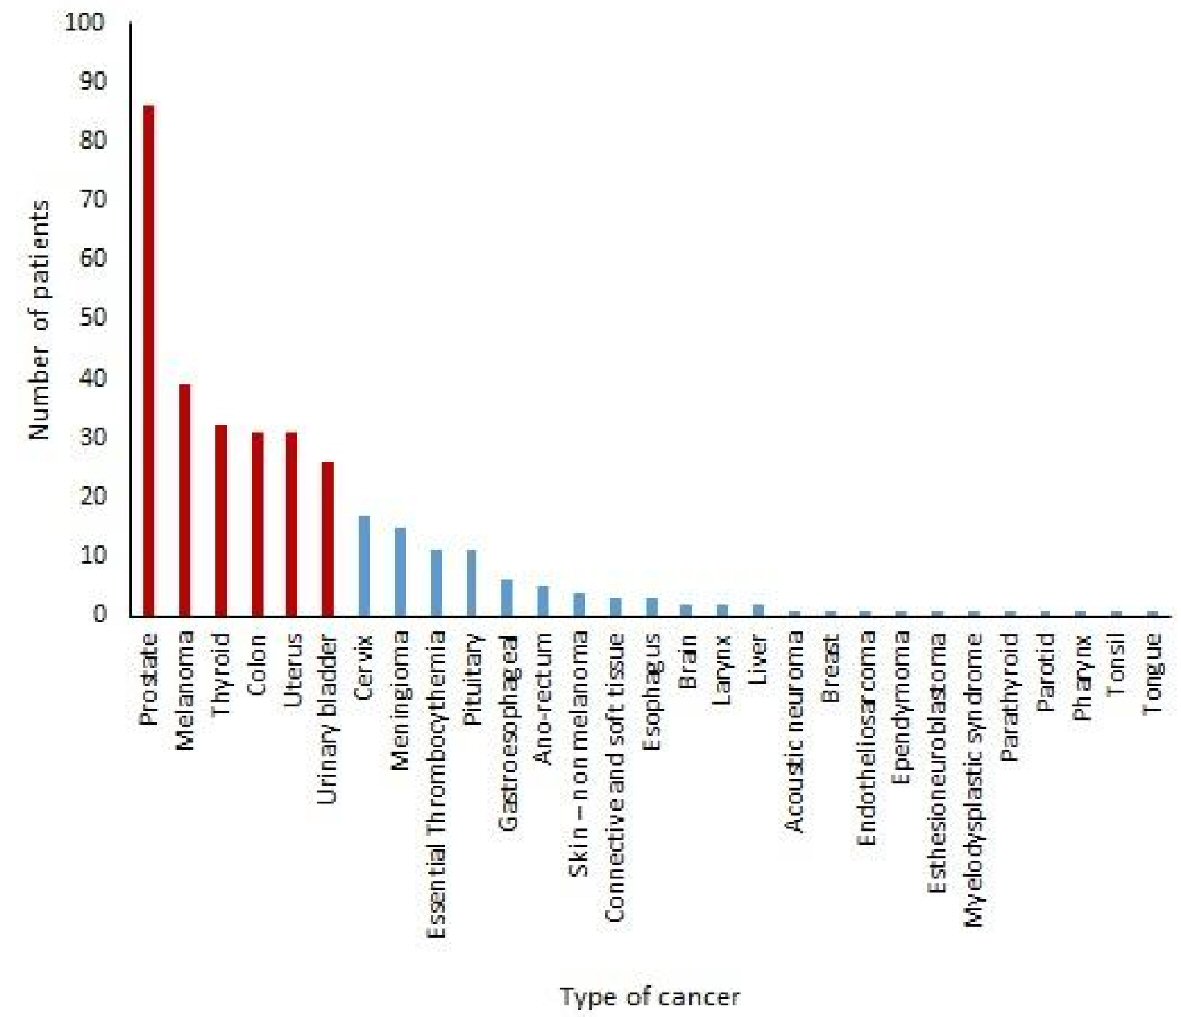
| Prostate (n, %) | 86 (30.7) |
| Melanoma (n, %) | 39 (13.9) |
| Thyroid (n, %) | 32 (11.4) |
| Colon (n, %) | 31 (11.1) |
| Uterus (n, %) | 31 (11.1) |
| Urinary bladder (n, %) | 26 (9.3) |
| Cervix (n, %) | 17 (6.1) |
| Meningioma (n, %) | 15 (5.3) |
| Essential thrombocythemia (n, %) | 11 (3.9) |
| Pituitary (n, %) | 11 (3.9) |
| Gastroesophageal (n, %) | 6 (2.1) |
| Ano-rectum (n, %) | 5 (1.8) |
| Skin-non melanoma (n, %) | 4 (1.4) |
| Connective and soft tissue (n, %) | 3 (1.1) |
| Esophagus (n, %) | 3 (1.1) |
| Brain (n, %) | 2 (0.7) |
| Larynx (n, %) | 2 (0.7) |
| Liver (n, %) | 2 (0.7) |
| Acoustic neuroma (n, %) | 1 (0.3) |
| Breast (n, %) | 1 (0.3) |
| Endotheliosarcoma (n, %) | 1 (0.3) |
| Ependymoma (n, %) | 1 (0.3) |
| Esthesioneuroblastoma (n, %) | 1 (0.3) |
| Myelodysplastic syndrome (n, %) | 1 (0.3) |
| Parathyroid (n, %) | 1 (0.3) |
| Parotid (n, %) | 1 (0.3) |
| Pharynx (n, %) | 1 (0.3) |
| Tonsil (n, %) | 1 (0.3) |
| Tongue (n, %) | 1 (0.3) |
| Comorbid condition | Prostate (n = 86) | Melanoma (n = 39) | Thyroid (n = 32) | Colon (n = 31) | Uterus (n = 31) | Bladder (n = 26) |
|---|---|---|---|---|---|---|
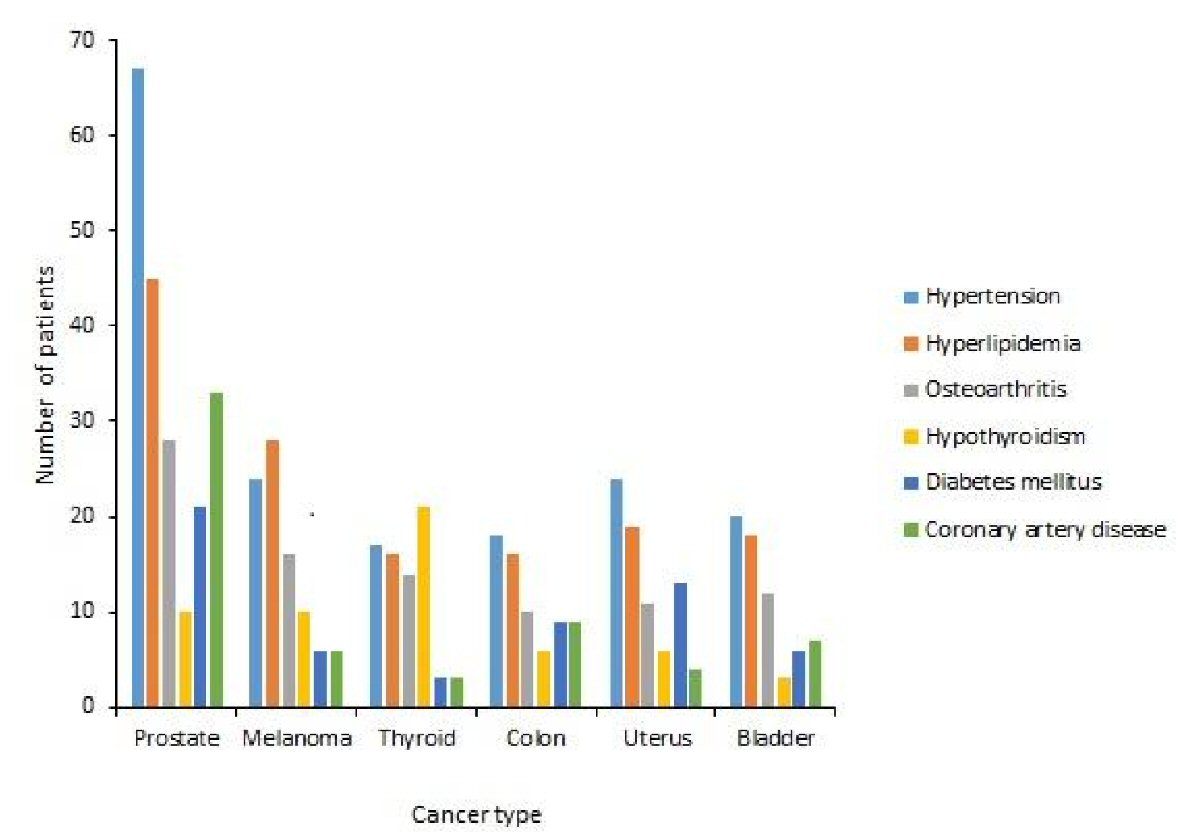
| Hypertension (n, %) | 67 (77.9) | 24 (61.5) | 17 (53.1) | 18 (58.1) | 24 (77.4) | 20 (76.9) |
| Hyperlipidemia (n, %) | 45 (52.3) | 28 (71.8) | 16 (50.0) | 16 (51.6) | 19 (61.3) | 18 (69.2) |
| Osteoarthritis (n, %) | 28 (32.6) | 16 (41.0) | 14 (43.8) | 10 (32.3) | 11 (35.5) | 12 (46.1) |
| Hypothyroidism (n, %) | 10 (11.6) | 10 (25.6) | 21 (65.6) | 6 (19.3) | 6 (19.4) | 3 (11.5) |
| Diabetes mellitus (n, %) | 21 (24.4) | 6 (15.4) | 3 (9.8) | 9 (29.0) | 13 (42.9) | 6 (23.1) |
| Coronary artery disease (n, %) | 33 (38.3) | 6 (15.4) | 3 (9.8) | 9 (29.0) | 4 (12.9) | 7 (26.9) |
| Variable | Group 1 (cancer survivors) (n = 280) | Group 2 (patients without cancer)(n = 280) | P* |
|---|---|---|---|
| *McNemar test. | |||
| Aspirin (n, %) | 156 (55.7) | 124 (44.3) | 0.403 |
| Statin (n, %) | 144 (51.4) | 138 (49.3) | 0.668 |
| Vitamin D (n, %) | 101 (36.1) | 103 (36.8) | 0.923 |
| Multivitamin (n, %) | 58 (20.7) | 46 (16.4) | 0.224 |
| Metformin (n, %) | 37 (13.2) | 32 (11.4) | 0.603 |
| Fish Oil (n, %) | 14 (5.0) | 10 (3.6) | 0.541 |