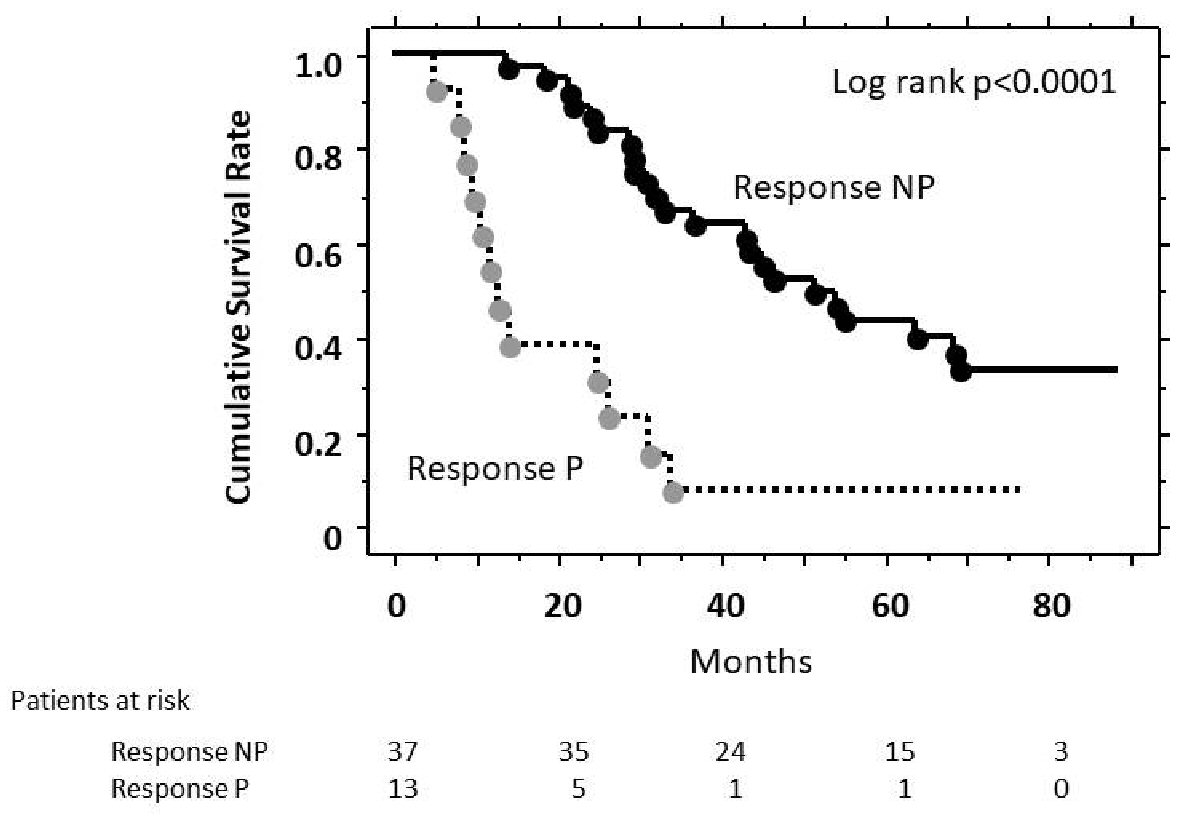
Figure 1. Estimates of cumulative survival rates according to response to TACE (Kaplan-Meier method). There was a significant difference in cumulative survival (P < 0.001, log-rank test) between Response P patients and Response NP patients.
| Journal of Clinical Medicine Research, ISSN 1918-3003 print, 1918-3011 online, Open Access |
| Article copyright, the authors; Journal compilation copyright, J Clin Med Res and Elmer Press Inc |
| Journal website http://www.jocmr.org |
Original Article
Volume 10, Number 10, October 2018, pages 765-771
Number of Nodules but not Size of Hepatocellular Carcinoma Can Predict Refractoriness to Transarterial Chemoembolization and Poor Prognosis
Figures
Tables
| Item | Data |
|---|---|
| Values are expressed as mean ± SD. The range of numbers is shown in parenthesis. *Child-Pugh score was not assessed in two patients due to missing data. **Numbers of tumors ≥ 11 are expressed as 11. ***Values of PIVKA-II < 30 are expressed as 0. B: hepatitis B virus; C: hepatitis C virus; NBNC: non-B non-C; Al: alcohol; AFP: alfa-feto protein; PIVKA-II: protein induced by vitamin K absence or antagonist-II. | |
| Age (years) | 71.6 ± 6.6 |
| Sex (male/female) | 41/9 |
| Etiology (B/C/NBNC/Al) | 10/31/4/5 |
| Total bilirubin (mg/dL) | 0.91 ± 0.33 |
| Prothrombin time (%) | 86.5 ± 10.2 |
| Albumin (g/dL) | 3.83 ± 0.0.35 |
| Platelets (× 104/µL) | 12.5 ± 5.6 |
| Child-Pugh classification (A/B/C) | 45/3/0* |
| Number of tumor nodules** | 4.5 ± 3.6 |
| Max size of tumor (mm) | 31.3 ± 23.0 (10 - 135) |
| Up-to-7 criteria (in/out) | 28/22 |
| AFP (ng/mL) | 1,745.6 ± 11,253.1 (2 - 78,845) |
| PIVKA-II (mAU/mL) | 2,331.4 ± 10,923.1 (0*** - 75,000) |
| Univariate | Multivariate | |||||
|---|---|---|---|---|---|---|
| HR | 95% CI | P | HR | 95% CI | P | |
| HR: hazard ratio; M: male; F: female; C: hepatitis C virus; AFP: alfa-feto protein; PIVKA-II: protein induced by vitamin K absence-II. | ||||||
| Age (years) | 1.060 | 0.998 - 1.127 | 0.059 | |||
| Sex (M vs. F) | 0.997 | 0.309 - 3.214 | 0.996 | |||
| Etiology (C vs. others) | 0.979 | 0.426 - 2.249 | 0.960 | |||
| Total bilirubin (mg/dL) | 4.166 | 1.396 - 12.432 | 0.011 | |||
| Prothrombin time (%) | 0.965 | 0.927 - 1.004 | 0.080 | |||
| Albumin (g/dL) | 0.629 | 0.248 - 1.596 | 0.329 | |||
| Platelets (× 104/µL) | 0.889 | 0.808 - 0.978 | 0.016 | |||
| AFP (≥ 10 vs. < 10) | 2.202 | 0.878 - 5.521 | 0.092 | |||
| PIVKA-II (≥ 75 vs. < 75) | 3.252 | 1.366 - 7.739 | 0.008 | 4.539 | 1.214 - 16.966 | 0.025 |
| Tumor number | 1.590 | 1.365 - 1.854 | 0.000 | 1.475 | 1.245 - 1.747 | 0.000 |
| Tumor size | 0.997 | 0.977 - 1.019 | 0.811 | |||
| Up to 7 (in vs. out) | 0.098 | 0.036 - 0.266 | 0.000 | |||
| Past TACE number | 1.711 | 1.333 - 2.194 | 0.000 | 1.472 | 1.058 - 2.048 | 0.022 |
| Univariate | Multivariate | |||||
|---|---|---|---|---|---|---|
| HR | 95% CI | P | HR | 95% CI | P | |
| HR: hazard ratio; M: male; F: female; C: hepatitis C virus; AFP: alfa-feto protein; PIVKA-II: protein induced by vitamin K absence-II. | ||||||
| Age (years) | 1.031 | 0.976 - 1.089 | 0.276 | |||
| Sex (M vs. F) | 0.629 | 0.515 - 2.998 | 0.629 | |||
| Etiology (C vs. others) | 0.921 | 0.468 - 1.815 | 0.813 | |||
| Total bilirubin (mg/dL) | 6.842 | 2.080 - 22.510 | 0.002 | |||
| Prothrombin time (%) | 0.995 | 0.922 - 0.989 | 0.010 | |||
| Albumin (g/dL) | 0.352 | 0.265 - 1.032 | 0.059 | |||
| Platelets (×104/µL) | 0.871 | 0.798 - 0.951 | 0.002 | 0.876 | 0.803 - 0.955 | 0.003 |
| AFP (≥ 10 vs. < 10) | 1.669 | 0.773 - 3.606 | 0.192 | |||
| PIVKA-II (≥ 75 vs. < 75) | 1.716 | 0.843 - 3.497 | 0.137 | |||
| Tumor number | 1.307 | 1.174 - 1.456 | 0.000 | 1.330 | 1.178-1.501 | 0.000 |
| Tumor size | 1.003 | 0.987 - 1.019 | 0.734 | |||
| Up to 7 (in vs. out) | 0.296 | 0.150 - 0.588 | 0.000 | |||
| Past TACE number | 1.103 | 0.907 - 1.341 | 0.327 | |||