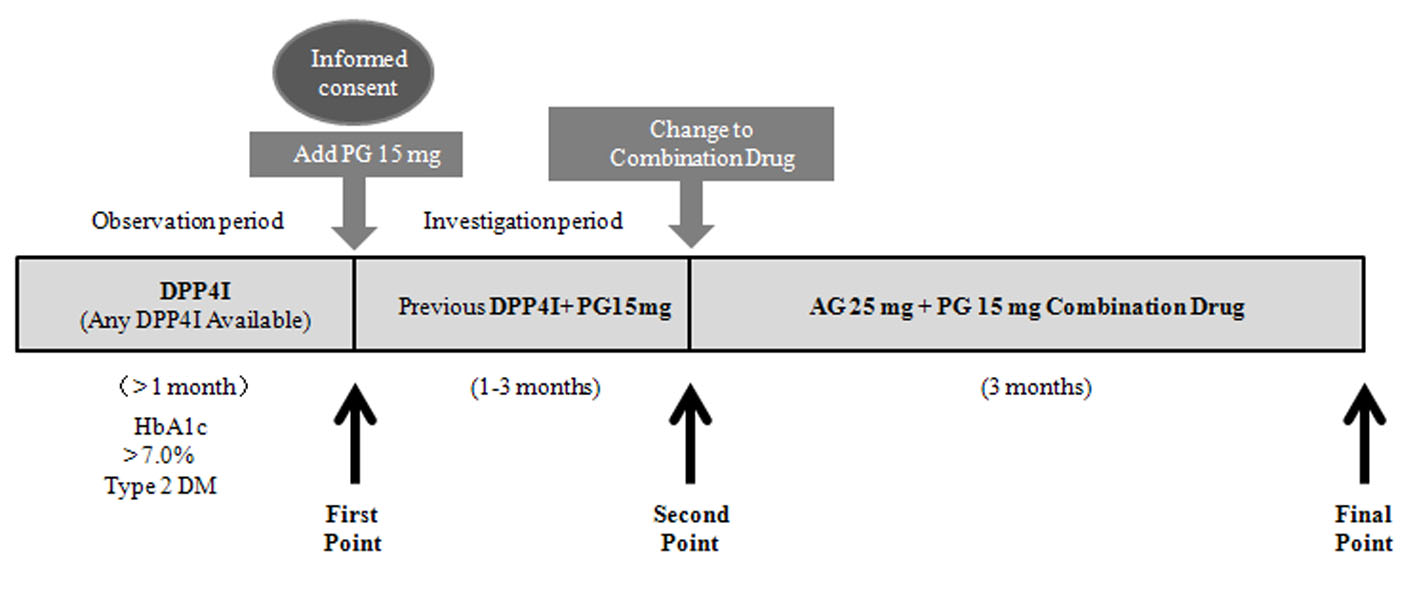
Figure 1. Study design (CHAT-LIO). CHAT: CHikushi Anti-Diabetes Mellitus Trial; LIO: LIOvel; DPP4I: dipeptidyl peptidase-4 inhibitor; HbA1c: hemoglobin A1c; DM: diabetes mellitus; PG: pioglitazone; AG: alogliptin.
| Journal of Clinical Medicine Research, ISSN 1918-3003 print, 1918-3011 online, Open Access |
| Article copyright, the authors; Journal compilation copyright, J Clin Med Res and Elmer Press Inc |
| Journal website http://www.jocmr.org |
Original Article
Volume 11, Number 2, February 2019, pages 89-97
Investigation of a Dipeptidyl Peptidase-4 Inhibitor/Thiazolidinedione Combination Drug for Patients With Type 2 Diabetes and Poor Glycemic Control: Difficulty With Patient Enrollment
Figures
Tables
| n: number of patients; SD: standard deviation; BMI: body mass index. | |
| Age, years, mean (SD) | 61 (13) |
| Sex, male, n (%) | 13 (68) |
| BMI, kg/m2, mean (SD) | 26.3 (4.5) |
| Hypertension, n (%) | 12 (63) |
| Dyslipidemia, n (%) | 9 (47) |
| Hyperuricemia, n (%) | 2 (11) |
| Ischemic heart disease, n (%) | 5 (26) |
| Cerebrovascular disease, n (%) | 2 (11) |
| Smoking, n (%) | 11 (61) |
| Drinking alcohol, n (%) | 11 (61) |
| HbA1c (%) | 8.2 (1.3) |
| Sulfonylurea, n (%) | 9 (47) |
| Biguanide, n (%) | 3 (16) |
| Alpha-glucosidase inhibitor, n (%) | 1 (5) |
| Insulin, n (%) | 0 (0) |
| Statin, n (%) | 6 (32) |
| Fibrate, n (%) | 1 (5) |
| Ezetimibe, n (%) | 3 (16) |
| Dose (mg) | n | |
|---|---|---|
| Alogliptin | 25 | 4 |
| Linagliptin | 5 | 1 |
| Sitagliptin | 50 | 2 |
| 100 | 3 | |
| Vildagliptin | 100 | 9 |
| First point | SD, IQR | Second point | SD, IQR | P value | Final point | SD, IQR | P value | |
|---|---|---|---|---|---|---|---|---|
| BW: body weight; WBC: white blood cell count; Hb: hemoglobin; PLT: platelet count; Alb: albumin; T-bil: total bilirubin; AST: aspartate aminotransferase; ALT: alanine aminotransferase; LDH: lactate dehydrogenase; ALP: alkaline phosphatase; γ-GTP: γ-glutamyl transpeptidase; CK: creatine kinase; eGFR: estimated glomerular filtration rate; FBG: fasting blood glucose; HbA1c: hemoglobin A1c; LDL-C: low-density lipoprotein cholesterol; HDL-C: high-density lipoprotein cholesterol; TG: triglycerides; UA: uric acid; IQR: interquartile range; FIB-4: fibrosis-4. | ||||||||
| BW, kg, mean (SD) | 68.4 | 13.1 | 69.0 | 13.1 | NS | 68.0 | 13.2 | NS |
| WBC, 103/µL, mean (SD) | 6,460 | 1,236 | 5,420 | 1,264 | < 0.05 | 5,580 | 992 | < 0.05 |
| Hb, g/dL, mean (SD) | 14.2 | 1.1 | 13.6 | 1.0 | 0.06 | 13.5 | 1.1 | < 0.05 |
| PLT, 104/µL, mean (SD) | 21.5 | 5.8 | 20.3 | 4.6 | NS | 21.6 | 5.8 | NS |
| Alb, g/dL, mean (SD) | 4.3 | 0.2 | 4.2 | 0.2 | NS | 4.2 | 0.3 | NS |
| T-bil, mg/dL, mean (SD) | 0.7 | 0.2 | 0.7 | 0.2 | NS | 0.6 | 0.2 | < 0.05 |
| AST, U/L, median (IQR) | 36 | 26 - 51 | 30 | 23 - 35 | < 0.05 | 29 | 23 - 31 | < 0.01 |
| ALT, U/L, median (IQR) | 33 | 26 - 58 | 26 | 20 - 33 | < 0.05 | 27 | 22 - 30 | < 0.01 |
| LDH, U/L, mean (SD) | 200 | 34 | 220 | 29 | < 0.005 | 216 | 31 | NS |
| ALP, U/L, mean (SD) | 230 | 48 | 202 | 43 | 0.09 | 190 | 32 | 0.07 |
| γ-GTP, U/L, median (IQR) | 43 | 25 - 71 | 24 | 20 - 48 | < 0.05 | 23 | 19 - 44 | < 0.01 |
| CK, U/L, mean (SD) | 116 | 42 | 146 | 75 | NS | 146 | 82 | NS |
| eGFR, mL/min/1.73 m2, mean (SD) | 95 | 18 | 88 | 16 | NS | 76 | 16 | 0.096 |
| FBG, mg/dL, mean (SD) | 195 | 74 | 148 | 43 | < 0.01 | 146 | 48 | < 0.05 |
| HbA1c, %, mean (SD) | 8.2 | 1.3 | 7.4 | 1.1 | < 0.05 | 7.3 | 1.1 | 0.06 |
| LDL-C, mg/dL, mean (SD) | 78 | 35 | 86 | 23 | NS | 80 | 20 | NS |
| HDL-C, mg/dL, mean (SD) | 54 | 14 | 60 | 13 | < 0.01 | 54 | 13 | NS |
| TG, mg/dL, median (IQR) | 122 | 94 - 396 | 115 | 82 - 174 | 0.07 | 111 | 75 - 227 | 0.051 |
| UA, mg/dL, mean (SD) | 4.8 | 1.0 | 4.4 | 1.2 | 0.08 | 5.3 | 1.4 | NS |
| FIB-4 index, mean (SD) | 1.77 | 0.55 | 1.70 | 0.64 | NS | 1.81 | 0.82 | NS |
| First point | Second point | Final point | Wilcoxon singed-rank test among each point | |
|---|---|---|---|---|
| NS: not significant. | ||||
| Adherence (%) | 82 | 94 | 78 | NS |