Journal of Clinical Medicine Research, ISSN 1918-3003 print, 1918-3011 online, Open Access
Article copyright, the authors; Journal compilation copyright, J Clin Med Res and Elmer Press Inc
Journal website http://www.jocmr.org

Original Article

Volume 10, Number 11, November 2018, pages 822-829


Higher Fasting and Postprandial Free Fatty Acid Levels Are Associated With Higher Muscle Insulin Resistance and Lower Insulin Secretion in Young Non-Obese Women

Figures

Figure 1.
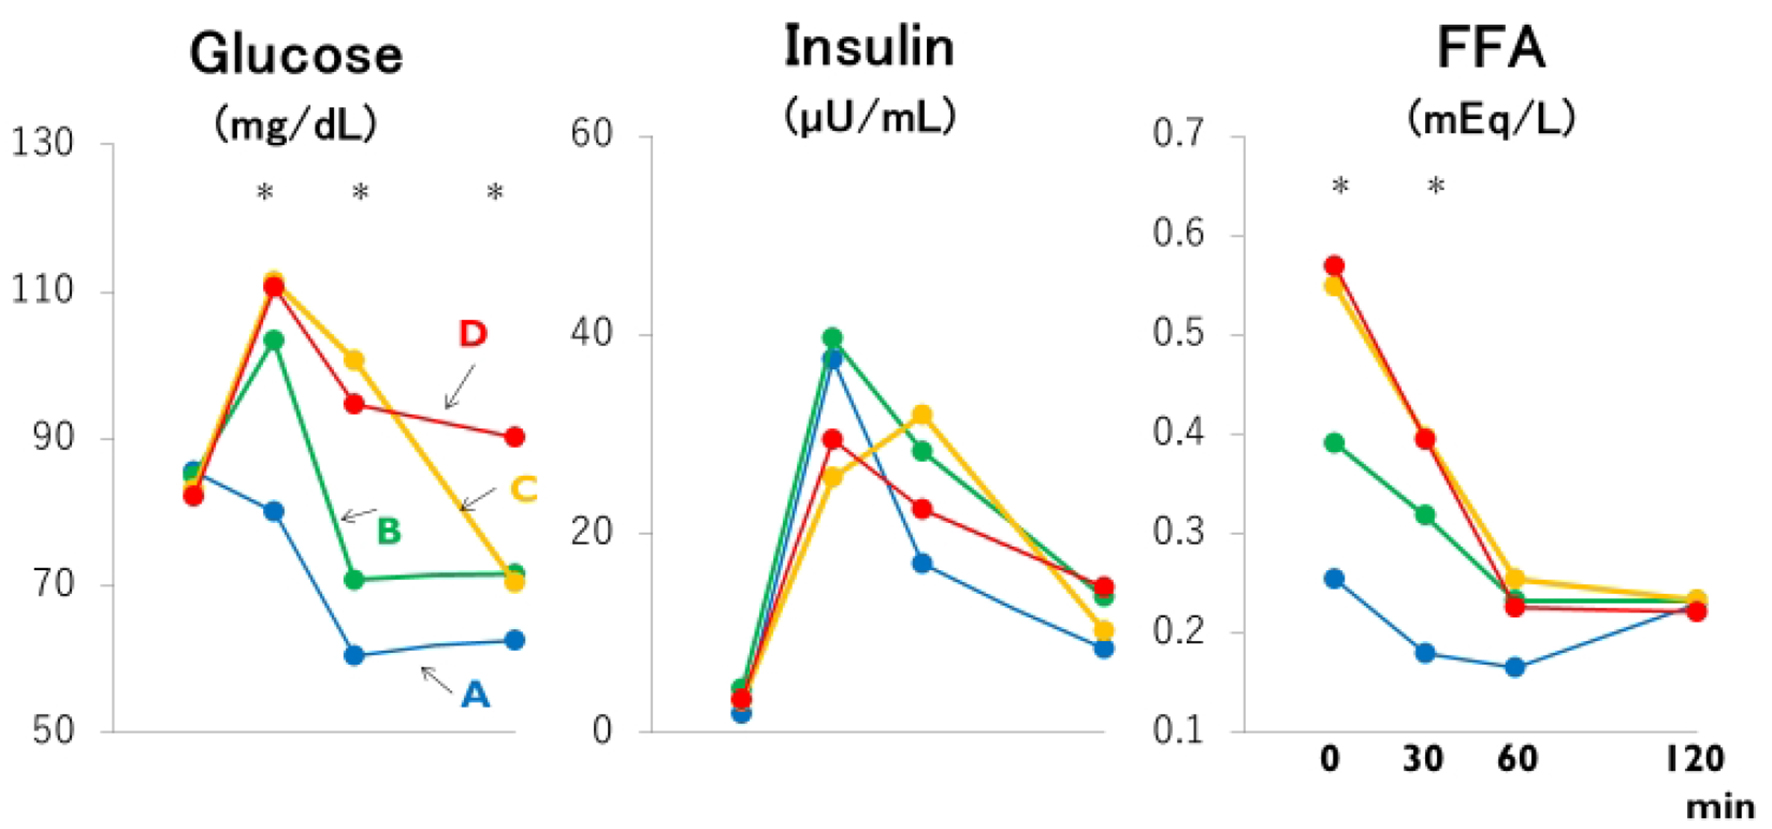
Figure 1. Mean plasma glucose, insulin and free fatty acid (FFA) concentrations based on the time (30, 60 and 120 min or never: groups A through D) that the plasma glucose concentration during the meal test declined below the fasting plasma glucose concentration. *: the difference is significant at P < 0.05 or less by ANOVA and Bonferroni’s multiple comparison procedure: 30-min glucose, A versus C and D; 60-min glucose and fasting FFA, A and B versus C and D; 120-min glucose, A, B and C versus D; 30-min FFA, A versus C. Group A: blue lines; B: green lines; C: yellow lines; D: red lines.
Figure 2.
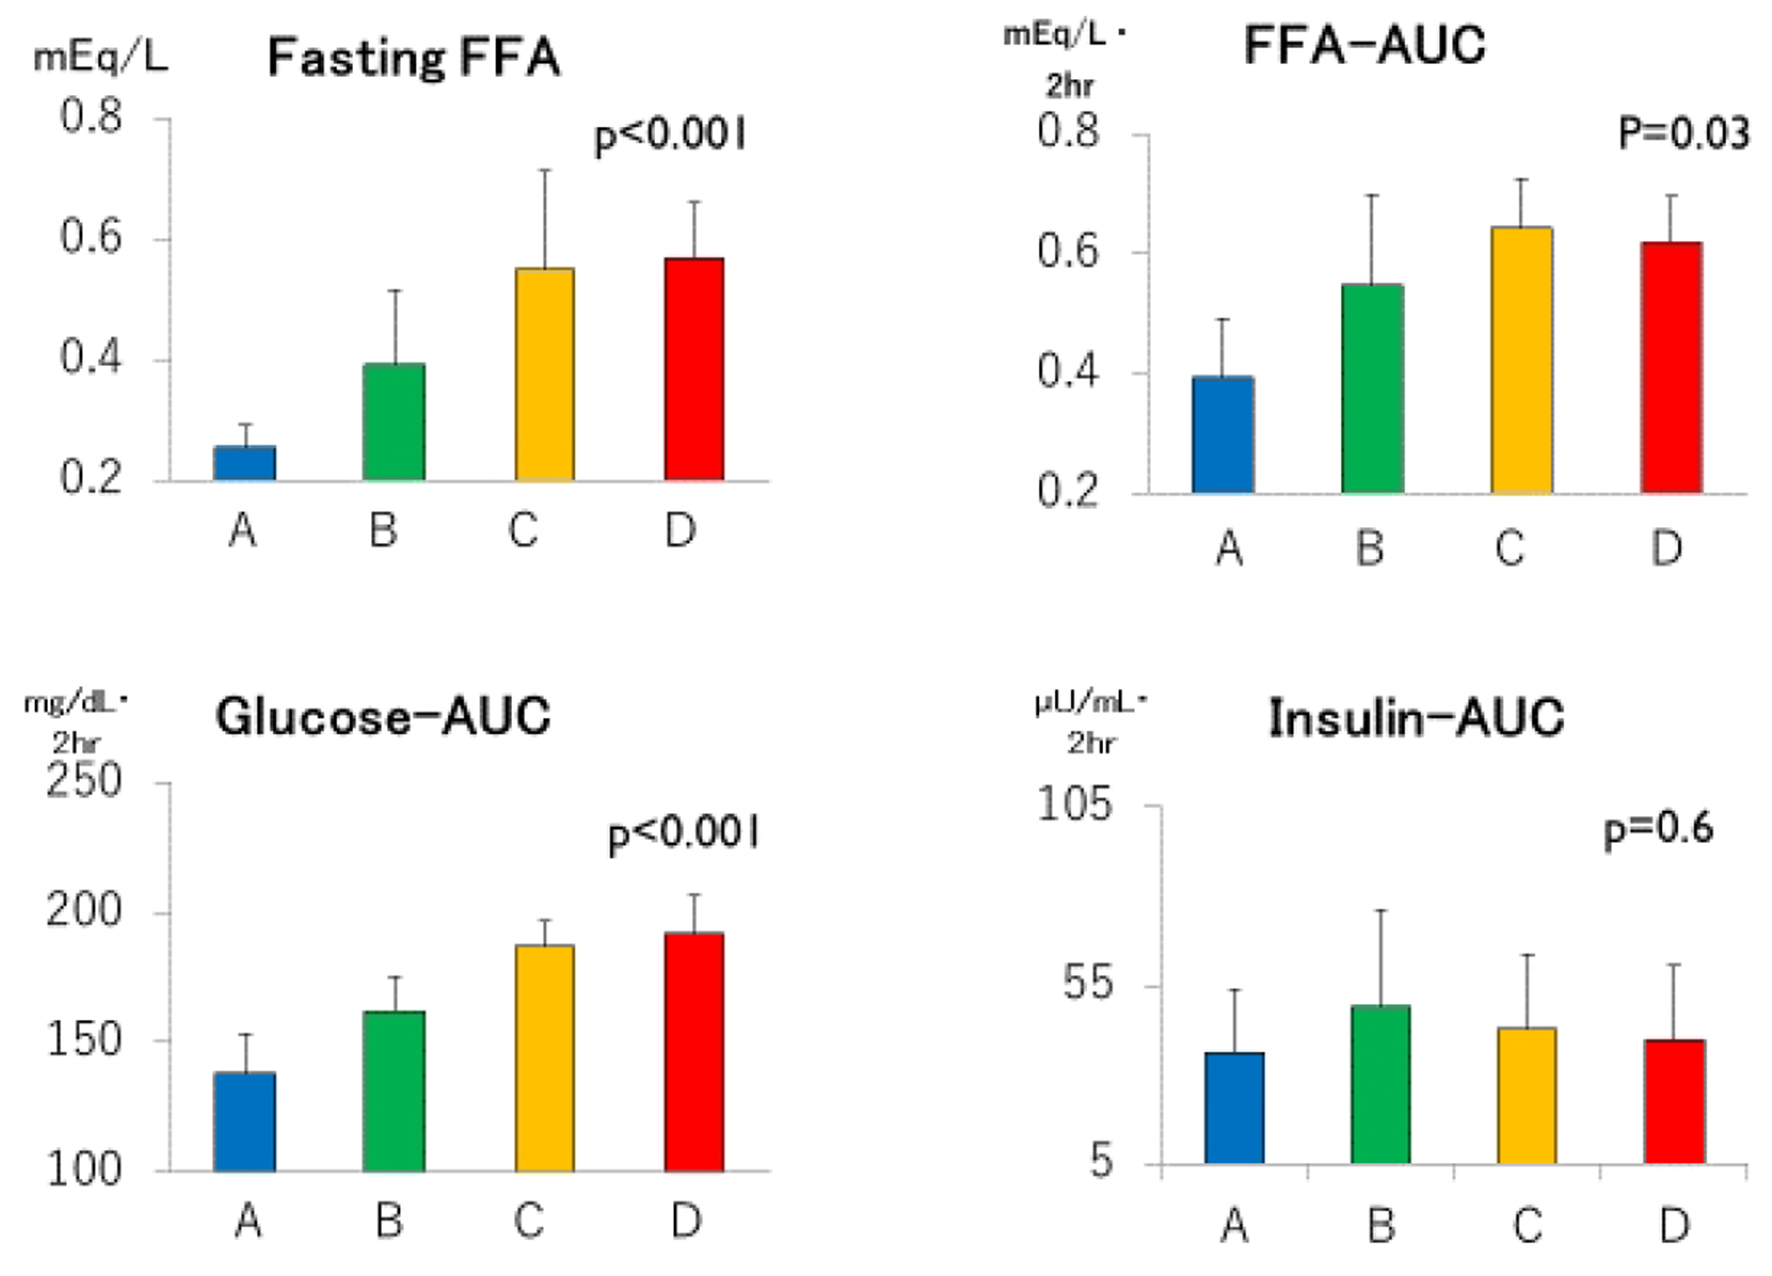
Figure 2. Fasting free fatty acids (FFAs), areas under the concentration curves of glucose, insulin and FFA (Glucose-AUC, Insulin-AUC and FFA-AUC, respectively) in groups A through D. Group A: blue columns; B: green columns; C: yellow columns; D: red columns. Data are expressed as mean ± SD. P values for trend derived using Jonckheeree-Terpstra test were shown.
Figure 3.
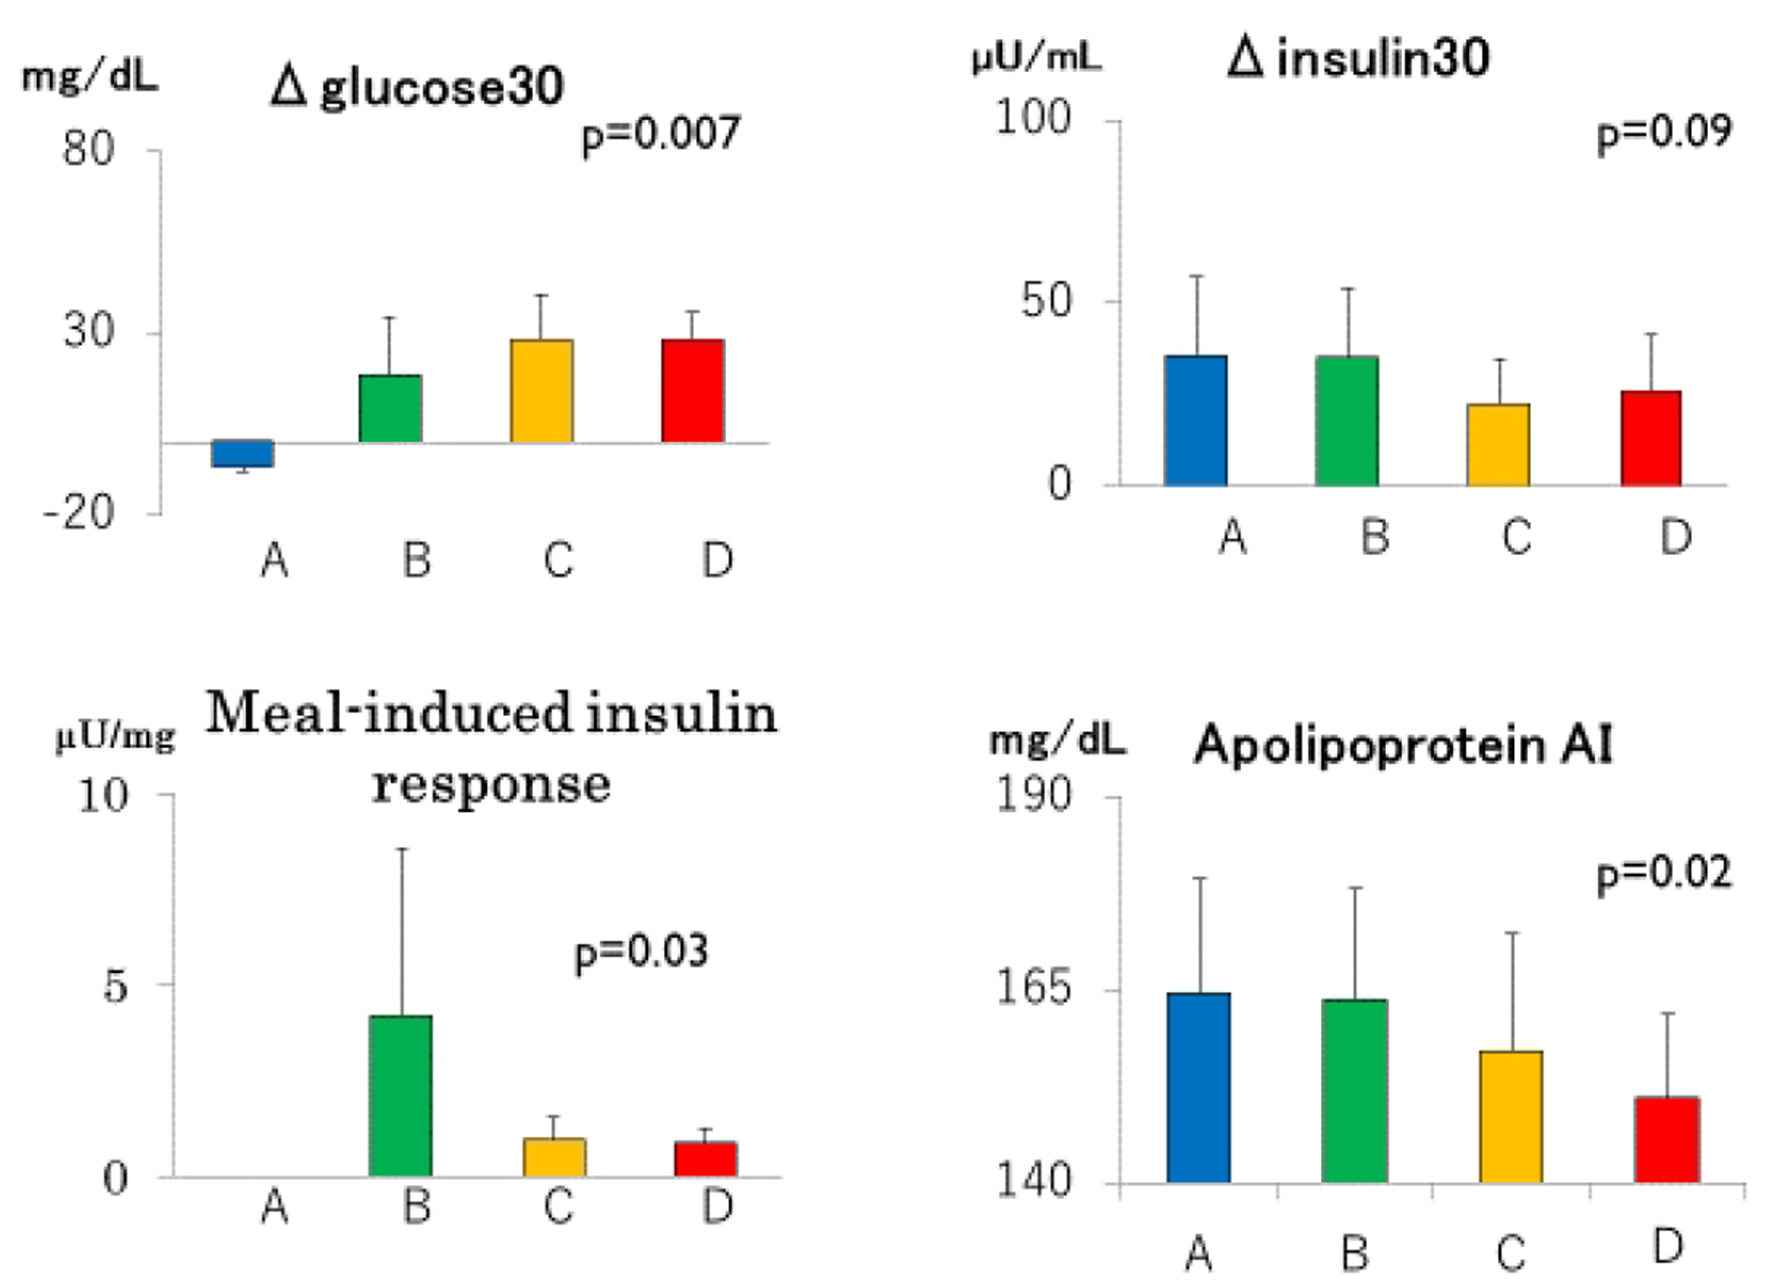
Figure 3. Incremental glucose (Δglucose30) and insulin (Δinsulin30) concentrations during the first 30 min of meal tests, meal-induced responses and serum apolipoprotein AI in groups A through D. Group A: blue columns; B: green columns; C: yellow columns; D: red columns. Data are expressed as mean ± SD. P values for trend derived using Jonckheeree-Terpstra test were shown.

Tables

Table 1. Anthropometric, Laboratory and Clinical Characteristics of the Four Study Groups Based on the Time (30, 60 and 120 Min or Never) That the Plasma Glucose (PG) Concentration During the OGTT Declined Below the Fasting PG Concentration
 
GroupABCD*#
n = 2n = 15n = 11n = 7
Data are expressed as mean ± SD. *P values by Jonckheeree-Terpstra trend test. #P values by ANOVA. FMI: fat mass index; hsCRP: high-sensitivity C-reactive protein.
BMI (kg/m2)23.3 ± 6.222.3 ± 2.421.3 ± 2.321.3 ± 1.50.340.67
FMI (kg/m2)7.40 ± 5.616.14 ± 2.065.22 ± 1.585.42 ± 1.320.440.70
Waist circumeference (cm)76.1 ± 10.074.1 ± 7.074.4 ± 6.371.4 ± 4.20.600.72
Percentage body fat (%)30.0 ± 16.727.4 ± 6.724.5 ± 5.525.8 ± 6.00.370.63
Trunk/leg fat ratio0.96 ± 0.031.27 ± 0.251.19 ± 0.321.24 ± 0.160.640.42
Cholesterol (mg/dL)205 ± 8182 ± 23173 ± 22172 ± 220.100.25
Triglycerides (mg/dL)59 ± 2058 ± 1652 ± 2152 ± 220.260.85
HDL cholesterol (mg/dL)83 ± 1176 ± 1272 ± 1268 ± 100.130.33
Apolipoprotein A1 (mg/dL)165 ± 15164 ± 15157 ± 15151 ± 110.020.24
Apolipoprotein B (mg/dL)79 ± 167 ± 1365 ± 1764 ± 110.270.59
Leptin (ng/mL)10.1 ± 5.48.3 ± 5.25.0 ± 2.06.5 ± 4.10.100.19
Adiponectin (µg/mL)17.1 ± 5.710.2 ± 3.912.0 ± 5.510.5 ± 2.70.920.20
hsCRP (µg/dL)13 ± 662 ± 12828 ± 4730 ± 550.140.74
Athletes (n, %)1, 508, 53.34, 36.44, 57.10.620.80
Positive family history (n, %)0/2, 0.06/13, 46.23/9, 33.31/7, 14.30.370.37
Birth weight (g)3,355 ± 783,090 ± 3973,252 ± 4522,960 ± 5290.380.80


Table 2. Responses of Glucose, Insulin and Free Fatty Acids to a Standardized Test Meal of the Four Study Groups Based on the Time (30, 60 and 120 Min or Never) That the Plasma Glucose (PG) Concentration During the OGTT Declined Below the Fasting PG Concentration
 
GroupABCD*#
n = 2n = 15n = 11n = 7
Data are expressed as mean ± SD. PG: plasma glucose; Δglucose30 and Δinsulin30: the increment in PG and serum insulin during the first 30 min of the meal test; HOMA-IR: homeostasis model assessment of insulin resistance; MIR: meal-induced insulin response; AUC: the area under the concentration curve; Adipo-IR: adipose insulin resistance; FFA: free fatty acid. *P values by Jonckheeree-Terpstra trend test. #P values by ANOVA. a, b and c: group A versus B, C and D, respectively; d and e: group B versus C and D, respectively; f: group C versus D by Bonferroni’s multiple comparison procedures.
Fasting PG (mg/dL)86 ± 885 ± 583 ± 482 ± 40.1740.532
30-min PG (mg/dL)80 ± 11103 ± 14111 ± 13111 ± 90.0190.017b, c
60-min PG (mg/dL)61 ± 1271 ± 10101 ± 1195 ± 160.0000.000b, c, d, e
120-min PG (mg/dL)63 ± 272 ± 870 ± 890 ± 50.0020.000c, e, f
Fasting insulin (µU/mL)2.0 ± 1.94.4 ± 2.63.2 ± 1.23.3 ± 1.20.6390.480
30-min insulin (µU/mL)38 ± 2040 ± 2126 ± 1329 ± 160.1010.230
60-min insulin (µU/mL)17 ± 928 ± 1932 ± 1622 ± 140.5640.531
120-min insulin (µU/mL)8 ± 314 ± 910 ± 715 ± 90.6930.552
Δglucose30 (mg/dL)-6 ± 419 ± 1628 ± 1228 ± 70.0070.009b, c
Δinsulin30 (µU/mL)36 ± 2235 ± 1922 ± 1226 ± 150.0980.239
HOMA-IR0.4 ± 0.40.9 ± 0.60.7 ± 0.20.7 ± 0.20.6160.430
MIR-4.2 ± 4.41.0 ± 0.60.9 ± 0.40.0300.031d
Glucose-AUC138 ± 16162 ± 13187 ± 9192 ± 140.0000.000b, c, d, e
Insulin-AUC36 ± 1849 ± 2743 ± 2140 ± 210.6380.779
Adipo-IR0.53 ± 0.561.66 ± 0.981.85 ± 1.111.90 ± 0.760.1110.343
Fasting FFA (mEq/L)0.26 ± 0.040.39 ± 0.130.55 ± 0.160.57 ± 0.090.0000.002b, c, d, e
30-min FFA (mEq/L)0.18 ± 0.030.32 ± 0.110.40 ± 0.100.39 ± 0.070.0080.022b
60-min FFA (mEq/L)0.17 ± 0.050.23 ± 0.090.25 ± 0.060.23 ± 0.030.2670.437
120-min FFA (mEq/L)0.23 ± 0.110.23 ± 0.060.23 ± 0.070.22 ± 0.030.7490.980
FFA-AUC0.39 ± 0.100.55 ± 0.150.64 ± 0.080.62 ± 0.080.0310.033