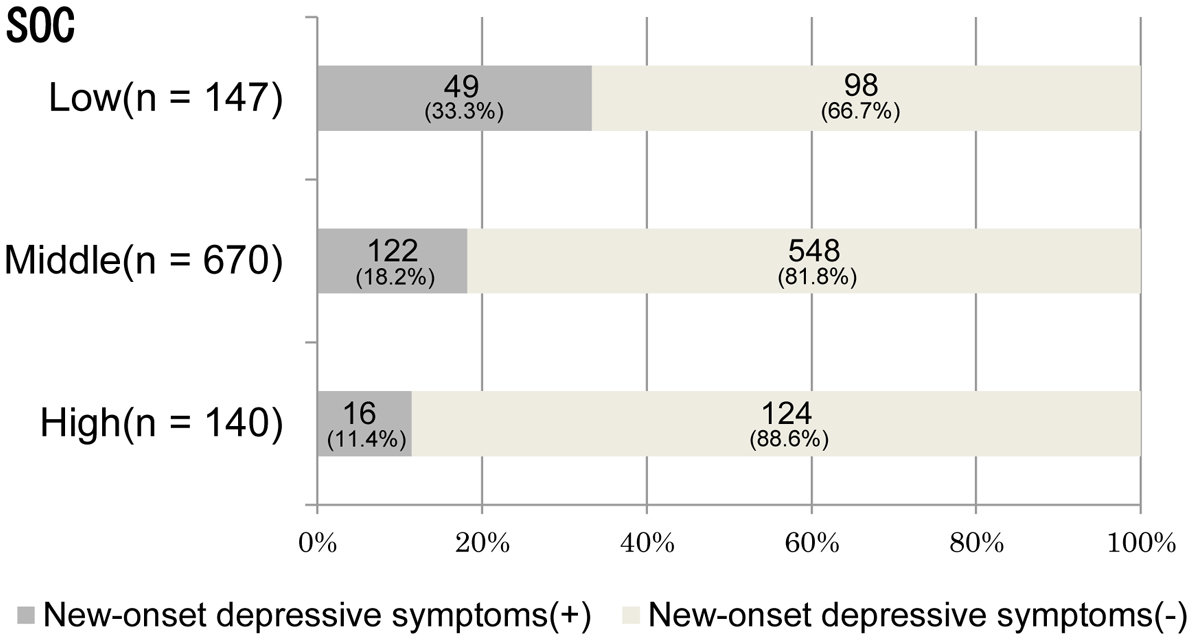
Figure 1. Figure 1. Relationship between the number of residents with new-onset depressive symptoms and SOC group (N = 957). SOC: sense of coherence. Chi-square P < 0.01.
| Journal of Clinical Medicine Research, ISSN 1918-3003 print, 1918-3011 online, Open Access |
| Article copyright, the authors; Journal compilation copyright, J Clin Med Res and Elmer Press Inc |
| Journal website http://www.jocmr.org |
Original Article
Volume 10, Number 9, September 2018, pages 715-721
Relationship Between Depression and Stress Coping Ability Among Residents in Japan: A Two-Year Longitudinal Study
Figure
Tables
| aN = 890 because 67 residents returned the survey but did not provide responses about working conditions. SOC: Sense of Coherence; SD: standard deviation. | |
| Age, mean ± SD, years | 26.0 ± 3.1 |
| Sex | |
| Male, n (%) | 621 (64.9) |
| Female, n (%) | 336 (35.1) |
| SOC score | |
| SOC score, mean ± SD | 44.3 ± 6.0 |
| Low, n (%) | 147 (15.4) |
| Middle, n (%) | 670 (70.0) |
| High, n (%) | 140 (14.6) |
| CES-D score at baseline, mean ± SD | 9.8 ± 7.6 |
| Hospital type | |
| University hospital, n (%) | 437 (45.7) |
| Other educational hospital, n (%) | 520 (54.3) |
| Working timea | |
| Mean ± SD, hours/week | 72.7 ± 15.2 |
| Residents working more than 80 h/ week, n (%) | 254 (28.5) |
| Variable | Residents without new-onset depressive symptoms (N = 770) | Residents with new-onset depressive symptoms (N = 187) | P |
|---|---|---|---|
| at test, bChi-square test, cN = 890 because 67 residents returned the survey but did not provide responses about working conditions. SOC: Sense of Coherence; SD: standard deviation; CES-D: Center for Epidemiologic Studies Depression. | |||
| Age, mean ± SD, yearsa | 25.9 ± 2.8 | 26.3 ± 3.9 | 0.14 |
| Male sex, n (%)b | 499 (64.8) | 122 (65.2) | 0.49 |
| SOC score, mean ± SDa | 44.9 ± 5.8 | 42.1 ± 6.2 | < 0.01 |
| CES-D score at baseline, mean ± SDa | 6.5 ± 4.0 | 8.8 ± 3.7 | < 0.01 |
| CES-D score at follow-up, mean ± SDa | 6.9 ± 4.4 | 21.7 ± 7.4 | < 0.01 |
| Hospital type | |||
| University hospital, n (%)b | 358 (46.5) | 79 (42.2) | 0.17 |
| Mean working timec | |||
| Mean ± SD, hours/weeka | 72.1± 14.3 | 74.8 ± 18.1 | 0.07 |
| Odds ratio | 95% CI | P | |
|---|---|---|---|
| Results of logistic regression analysis where the dependent variable is new-onset depressive symptoms and the independent variables are SOC group, CES-D score at baseline, age, sex, hospital type, and mean working time. aCoded as: 0 = male; 1 = female. bCoded as: 0 = university hospital; 1 = other educational hospital. CI: confidence interval; SOC: Sense of Coherence; CES-D: Center for Epidemiologic Studies Depression. | |||
| SOC score group | |||
| Low | 2.04 | 1.02 - 4.05 | 0.04 |
| High | 1 | ||
| CES-D score at baseline | 1.14 | 1.08 - 1.19 | < 0.01 |
| Age | 1.06 | 1.01- 1.11 | 0.03 |
| Sexa | 1.04 | 0.72 - 1.50 | 0.84 |
| Hospital typeb | 1.21 | 0.84 - 1.73 | 0.3 |
| Mean working time | 1.01 | 1.00 - 1.03 | 0.02 |