Journal of Clinical Medicine Research, ISSN 1918-3003 print, 1918-3011 online, Open Access
Article copyright, the authors; Journal compilation copyright, J Clin Med Res and Elmer Press Inc
Journal website http://www.jocmr.org

Original Article

Volume 10, Number 8, August 2018, pages 657-664


Pretreatment Lymphocyte to Monocyte Ratio as a Prognostic Marker for Advanced Pulmonary Squamous Cell Carcinoma Treated With Chemotherapy

Figures

Figure 1.
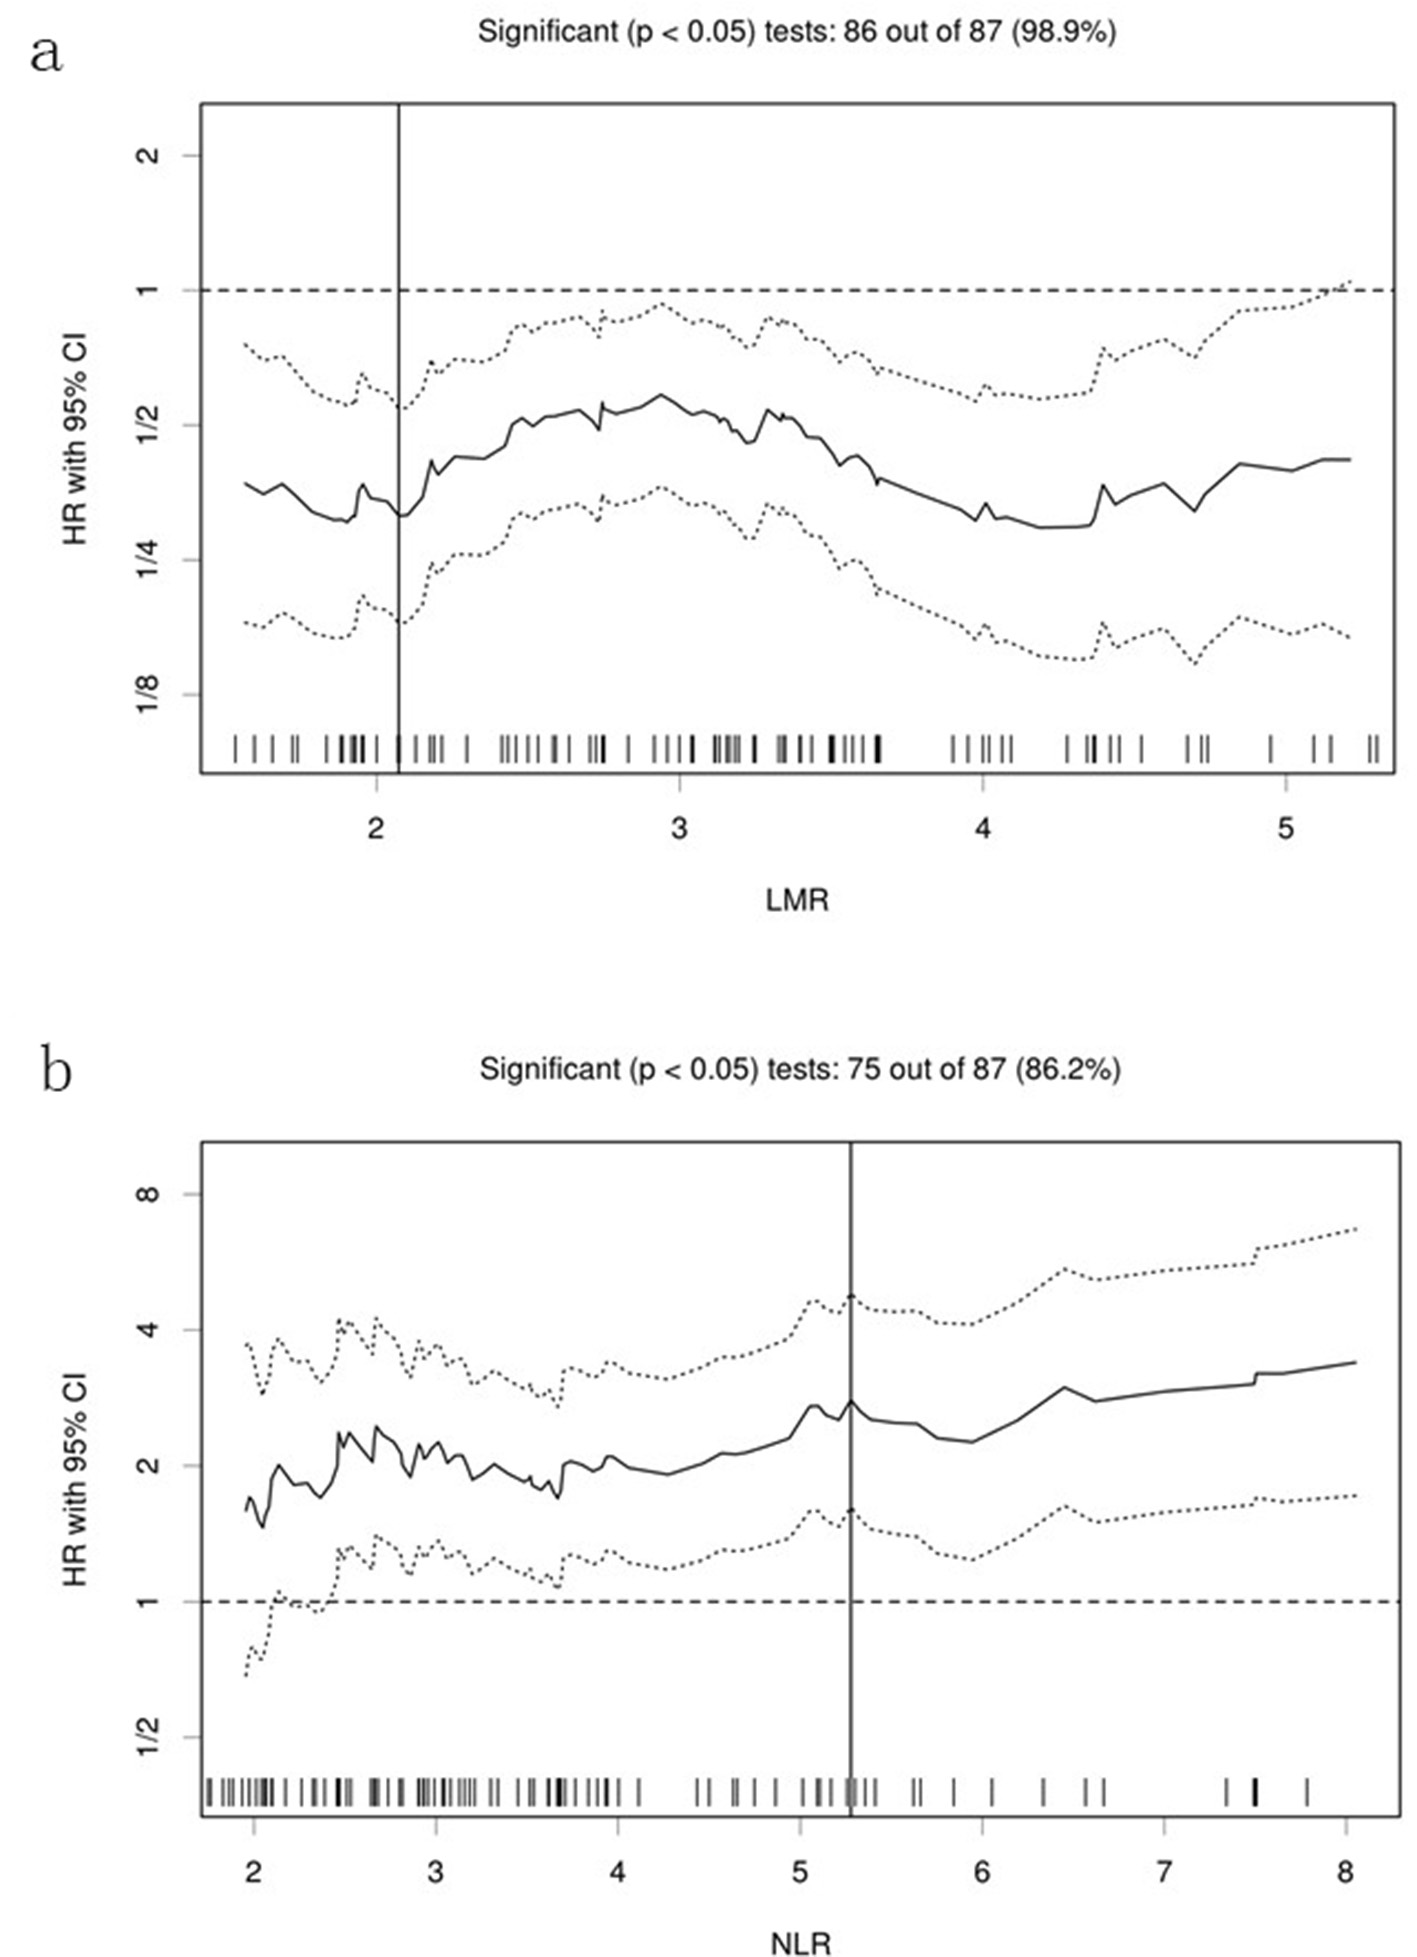
Figure 1. Hazard ratios and cutoff points of LMR and NLR for overall survival of patients with pulmonary squamous cell carcinoma. (a) LMR; (b) NLR. The plots were determined using Cutoff Finder. The vertical lines are the optimal cutoff points providing the most significant split (log-rank test). LMR: lymphocyte to monocyte ratio; NLR: neutrophil to lymphocyte ratio; HR: hazard ratio; OS: overall survival.
Figure 2.
Figure 2. Kaplan-Meier survival curves of overall survival according to LMR, NLR and mGPS. (a) LMR; (b) NLR; (c) mGPS. LMR: lymphocyte to monocyte ratio; mGPS: modified Glasgow prognostic score; NLR: neutrophil to lymphocyte ratio.

Tables

Table 1. Backgrounds and Laboratory Data at the Start of First-Line Chemotherapy
 
AllLMRPNLRPmGPSP
< 2.07≥ 2.07< 5.28≥ 5.280 - 12
amean ± SD; bMann-Whitney test; cFisher’s exact test. Alb: albumin; ALP: alkaline phosphatase; BMI: body mass index; Ccr: creatinine clearance; CRP: C-reactive protein; ECOG PS: Eastern Cooperative Oncology Group performance status; Hb: hemoglobin; LDH: lactate dehydrogenase; LMR: lymphocyte to monocyte ratio; Lym: lymphocyte; Mono: monocyte; mGPS: modified Glasgow prognostic score; Neu: neutrophil; NLR: neutrophil to lymphocyte ratio; SD: standard deviation.
N107248382256938
Background
  Age (years)a70.2 ± 8.269.4 ± 9.470.5 ± 7.80.66b70.8 ± 7.968.4 ± 8.90.16b69.9 ± 8.870.9 ± 7.00.87b
    < 75/≥ 75 years68/3915/953/301.00c50/3218/70.35c42/2726/120.53c
  Sex (N)
    Male/female82/2518/664/190.79c63/1919/61.00c50/1932/60.23c
  Stage (N)
    IIIB/IV/rec41/56/107/15/234/41/80.54c35/37/106/19/00.02c23/37/918/19/10.13c
  ECOG PS (N)
    0 - 1/2/3 - 481/22/416/8/065/14/40.17c70/10/211/12/2< 0.01c55/13/126/9/20.30c
  BMIa21.3 ± 3.220.5 ± 2.921.5 ± 3.30.24b21.4 ± 3.220.7 ± 3.20.34b21.4 ± 3.021.0 ± 3.60.29b
    < 18.5/≥ 18.521/866/1815/680.56 c16/665/201.00c56/1330/80.80c
Laboratory dataa
  Neu (cells/µL)6,069 ± 2,8187,698 ± 3,3445,598 ± 2,475< 0.01b5,045 ± 1,6259,428 ± 3,289< 0.01b5,425 ± 2,5187,238 ± 2,986< 0.01b
  Lym (cells/µL)1,636 ± 6591,136± 3881,781 ± 652< 0.01b1,771 ± 6581,195 ± 441< 0.01b1,725 ± 6821,475 ± 5910.04b
  Mono (cells/µL)560 ± 227791 ± 282493 ± 155< 0.01b512 ± 184719 ± 281< 0.01b512 ± 219648 ± 217< 0.01b
  NLR4.31 ± 2.927.47 ± 4.113.40 ± 1.59< 0.01b3.06 ± 1.018.40 ± 3.39< 0.01b3.60 ± 2.555.60 ± 3.14< 0.01b
  LMR3.31 ± 1.751.52 ± 0.473.82 ± 1.64< 0.01b3.75 ± 1.721.86 ± 0.83< 0.01b3.78 ± 1.892.45 ± 1.03< 0.01b
  Hb (g/dL)12.0 ± 1.911.0 ± 1.912.2 ± 1.80.01b12.1 ± 1.811.4 ± 2.10.12b12.5 ± 1.710.9 ± 1.8< 0.01b
  Sodium (mEq/L)138.3 ± 3.2136.9 ± 4.0138.8 ± 2.90.01b138.9 ± 2.7136.4 ± 4.1< 0.01b138.5 ± 2.7138.0 ± 4.00.61b
  Ccr (mL/min)55.1 ± 14.952.8 ± 13.655.8 ± 15.20.58b54.7 ± 15.056.6 ± 14.50.42b56.3 ± 16.653.1 ± 11.10.55b
  LDH (IU/L)225.7 ± 136.0283.3 ± 258.2209.0 ± 62.90.19b229.2 ± 152.8214.0 ± 51.90.57b234.3 ± 155.4210.0 ± 90.50.14b
  ALP (IU/L)292.0 ± 152.4344.6 ± 165.7276.8 ± 145.90.02b279.8 ± 148.0332.1 ± 162.70.048b282.5 ± 115.2309.3 ± 204.20.18b
  Alb (g/dL)3.4 ± 0.63.2 ± 0.63.5 ± 0.5< 0.01b3.6 ± 0.53.1 ± 0.6< 0.01b3.7 ± 0.42.9 ± 0.5< 0.01b
  CRP (mg/dL)3.7 ± 4.47.3 ± 6.22.6 ± 3.1< 0.01b2.5 ± 3.07.5 ± 5.9< 0.01b1.7 ± 2.37.3 ± 4.9< 0.01b
  mGPS
    0/1/239/30/384/7/1335/23/250.04c36/24/223/6/16< 0.01c---


Table 2. Treatment and Efficacy
 
LMRPNLRPmGPSP
< 2.07≥ 2.07< 5.28≥ 5.280 - 12
aFisher’s exact test; blog-rank test. CBDCA: carboplatin; CDDP: cisplatin; CI: confidence interval; DCR; disease control rate; ICI: immuno-checkpoint inhibitor; LMR: lymphocyte to monocyte ratio; mGPS: modified Glasgow prognostic score; nab-PTX: albumin-bound paclitaxel; NLR: neutrophil to lymphocyte ratio; PFS: progression-free survival; PTX: paclitaxel; RR: response rate; TRT: thoracic radiotherapy.
N248382256938
First-line regimen
  Single or combination (N)
    Single/combination1/239/740.45a8/742/231.00a6/634/340.74a
  Platinum-based (N)
    CBDCA-based21711.00a72200.34a61310.39a
    CDDP-based230.31a230.08a230.35a
  PTX-containing (N)9340.82a33101.00a29140.68a
  nab-PTX-containing (N)8190.30a1980.43a16110.64a
  S-1 containing (N)5240.60a2540.20a19101.00a
  
Concurrent TRT (N)291.00a740.28a650.52a
First-line response
  RR (%) (95% CI)20.8 (7.1 - 42.2)48.2 (37.1 - 59.4)0.02a47.6 (36.4 - 58.9)24.0 (9.4 - 45.1)0.04a43.5 (31.6 - 56.0)39.5 (24.0 - 56.6)0.84a
  DCR (%) (95% CI)54.2 (32.8 - 74.4)68.7 (57.6 - 78.4)0.23a69.5 (58.4 - 79.2)52.0 (31.3 - 72.2)0.15a66.7 (54.3 - 77.6)63.2 (46.0 - 78.2)0.83a
  PFS (months) (95% CI)2.4 (1.7 - 5.4)5.1 (4.0 - 6.5)<0.01b5.1 (4.1 - 6.5)2.4 (1.9 - 5.3)0.02b4.8 (3.7 - 5.9)4.2 (3.1 - 6.5)0.32b
Second or further line (N)9550.02a54100.03a45190.15a
  ICI (N)120.54a301.0300.551


Table 3. Univariate Cox Proportional Hazard Analysis of Factors Associated With Overall Survival
 
HR95% CIP
ALP: alkaline phosphatase; BMI: body mass index; Ccr: creatinine clearance; CI: confidence interval; CRP: C-reactive protein; ECOG PS: Eastern Cooperative Oncology Group performance status; HR: hazard ratio; LDH: lactate dehydrogenase; LMR: lymphocyte to monocyte ratio; mGPS: modified Glasgow prognostic score; NLR: neutrophil to lymphocyte ratio.
Age (years)
  < 75 versus ≥ 751.200.75 - 1.930.45
Sex
  Female versus male1.620.90 - 2.910.11
Distant metastasis
  No versus yes1.470.92 - 2.370.11
ECOG PS
  0 - 1 versus 2 - 42.921.76 - 4.86< 0.01
BMI
  ≥ 18.5 versus < 18.51.420.80 - 2.520.23
Hemoglobin (g/dL)0.960.85 - 1.090.55
Ccr (mL/min) (/10)1.020.88 - 1.180.81
Sodium (mEq/L) (/10)
  ≥ 135 versus < 1350.910.45 - 1.820.78
LDH (IU/L) (/100)1.030.85 - 1.230.80
ALP (IU/L) (/100)1.050.90 - 1.210.55
Albumin (g/dL)0.720.49 - 1.070.10
CRP (mg/dL)1.091.03 - 1.15< 0.01
NLR
  < 5.28 versus ≥ 5.282.801.62 - 4.83< 0.01
LMR
  ≥ 2.07 versus < 2.078.000.18 - 0.54< 0.01
mGPS
  0,1 versus 21.140.70 - 1.850.61


Table 4. Multivariate Cox Proportional Hazard Analysis of Factors Associated With Overall Survival
 
HR95% CIP
CI: confidence interval; CRP: C-reactive protein; ECOG PS: Eastern Cooperative Oncology Group performance status; HR: hazard ratio; LMR: lymphocyte to monocyte ratio; NLR: neutrophil to lymphocyte ratio.
Sex
  Female versus male1.320.71 - 2.430.38
Distant metastasis
  No versus yes1.540.90 - 2.600.11
ECOG PS
  0 - 1 versus 2 - 43.091.77 - 5.40< 0.01
Albumin (g/dL)1.240.76 - 2.040.39
CRP (mg/dL)1.030.96 - 1.100.42
NLR
  < 5.28 versus ≥ 5.281.370.67 - 2.790.39
LMR
  < 2.07 versus ≥ 2.070.410.21 - 0.79< 0.01