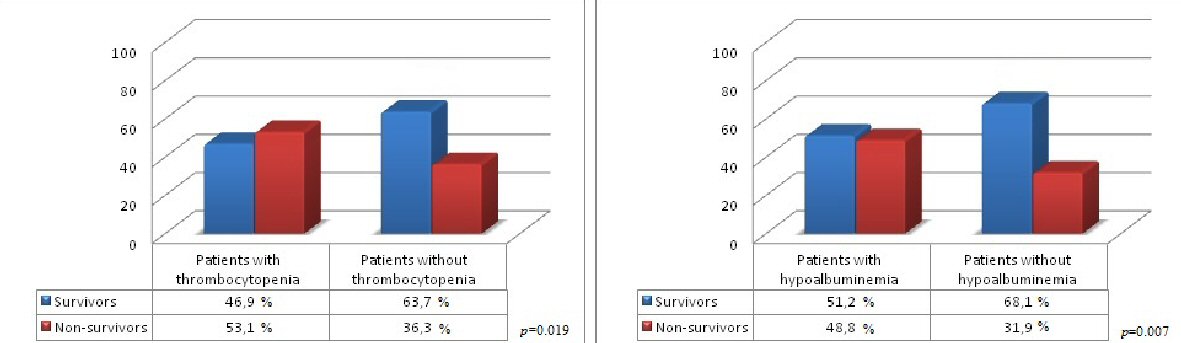
Figure 1. The relationship of platelet count and albumin level at the time of admission with motality.
| Journal of Clinical Medicine Research, ISSN 1918-3003 print, 1918-3011 online, Open Access |
| Article copyright, the authors; Journal compilation copyright, J Clin Med Res and Elmer Press Inc |
| Journal website http://www.jocmr.org |
Original Article
Volume 10, Number 7, July 2018, pages 588-592
The Impact of Nutritional Status and Complete Blood Count Parameters on Clinical Outcome in Geriatric Critically Ill Patients
Figures
Tables
| All (n = 243), n (%) | |
|---|---|
| APACHE II: acute physiology and chronic health evaluation score II. | |
| Age (year) (± SD) | 78.96 ± 6.62 |
| Gender | |
| Male | 104 (42.8%) |
| Female | 139 (57.2%) |
| Number of comorbidities (median) | 3.0 (1.0 - 8.0) |
| APACHE II (median) | 26.0 (9.0 - 47.0] |
| Length of stay (mean ± SD) | 10.23 ± 8.68 |
| Microbiologically documented infection | |
| Yes | 59 (24.2%) |
| No | 184 (75.8%) |
| Final status | |
| Survivor | 144 (59.3%) |
| Nonsurvivor | 99 (40.7%) |
| All Patients (n = 243) | Survivors(n = 144) | Non-survivors (n = 99) | P | |
|---|---|---|---|---|
| Median (range) | Median (range) | Median (range) | ||
| APACHE II: acute physiology and chronic health evaluation score II. | ||||
| APACHE II | 26.0 (9.0 - 47.0) | 21.0 (9.0 - 40.0) | 31.0 (13.0 - 47.0) | 0 |
| Albumin (g/dL) | 3.1 (1.1 - 4.9) | 3.2 (1.7 - 4.9) | 2.9 (1.1 - 4.7) | 0.001 |
| Hemoglobin (g/dL) | 11.1 (5.0 - 17.6) | 11.3 (5.0 - 17.0) | 10.8 (6.4 - 17.6) | 0.454 |
| Platelet (/mm3) | 197000.0 (15060.0 - 835300.0) | 199850.0 (15060.0 - 835300.0) | 178000.0 (25350.0 - 737000.0) | 0.095 |
| Leukocyte (/mm3) | 12560.0 (1660.0 - 44160.07) | 11765.0 (1660.0 - 44160.0) | 12950.0 (3885.0 - 34610.0) | 0.19 |
| Lymphocyte (/mm3) | 876.0 (79.0 - 9410.0) | 895.5 (172.0 - 9410.0) | 840.0 (79.0 - 3461.0) | 0.109 |
| Mean platelet volume | 7.7 (4.3 - 16.2) | 7.6 (4.3 - 15.3) | 8.0 (4.4 - 16.2) | 0.26 |
| Platelet/lymphocyte ratio | 205.3 (12.8 - 1675.0) | 201.8 (12.8 - 1236.6) | 205.3 (27.1 - 1675.0) | 0.838 |
| All (n = 89) (%) | |
|---|---|
| MRCoNS: methicillin-resistant coagulase-negative staphylococci. | |
| Gram positive bacteria | 43 (48.3%) |
| MRCoNS | 14 |
| Corynebacterium striatum | 11 |
| Enterococcus faecium | 6 |
| Others | 12 |
| Gram negative bacteria | 31 (34.8%) |
| Escherichia coli | 8 |
| Pseudomonas aeruginosa | 6 |
| Klebsiella Pneumoniae | 5 |
| Acinetobacter baumannii | 5 |
| Others | 7 |
| Fungal agents | 15 (16.9%) |
| Candida albicans | 10 |
| Candida tropicalis | 4 |
| Candida parapsilosis | 1 |
| All Patients (n = 243) | Patients without MDI (n = 184) | Patients with MDI (n = 59) | P | |
|---|---|---|---|---|
| Median (range) | Median (range) | Median (range) | ||
| APACHE II: acute physiology and chronic health evaluation score II; MDI: microbiologically documented infection. | ||||
| APACHE II | 26.0 (9.0 - 47.0) | 23.0 (9.0 - 44.0) | 31.0 (16.0 - 47.0) | 0 |
| Albumin (g/dL) | 3.1 (1.1 - 4.9) | 3.2 (1.1 - 4.9) | 2.9 (1.6 - 4.0) | 0.004 |
| Hemoglobin (g/dL) | 11.1 (5.0 - 17.6) | 11.3 (5.0 - 17.2) | 10.8 (6.4 - 17.6) | 0.573 |
| Leukocyte (/mm3) | 12560.0 (1660.0 - 44160.0) | 12280.0 (1660.0 - 44160.0) | 12950.0 (5420.0 - 3743.0) | 0.487 |
| Platelet (/mm3) | 197000.0 (15060.0 - 835300.0) | 192050.0 (15060.0 - 831200.0) | 215000.0 (50760.0 - 835300.0) | 0.097 |
| Lymphocyte (/mm3) | 876.0 (79.0 - 9410.0) | 865.0 (79.0 - 9141.0) | 962.0 (221.0 - 9410.0) | 0.636 |
| Mean platelet volume | 7.7 (4.3 - 16.2) | 7.6 (4.3 - 16.2) | 7.9 (4.4 - 13.3) | 0.538 |
| Platelet/lymphocyte ratio | 205.3 (12.8 - 1675.0) | 195.8 (12.8 - 1675.0) | 219.8 (27.1 - 1102.7) | 0.398 |