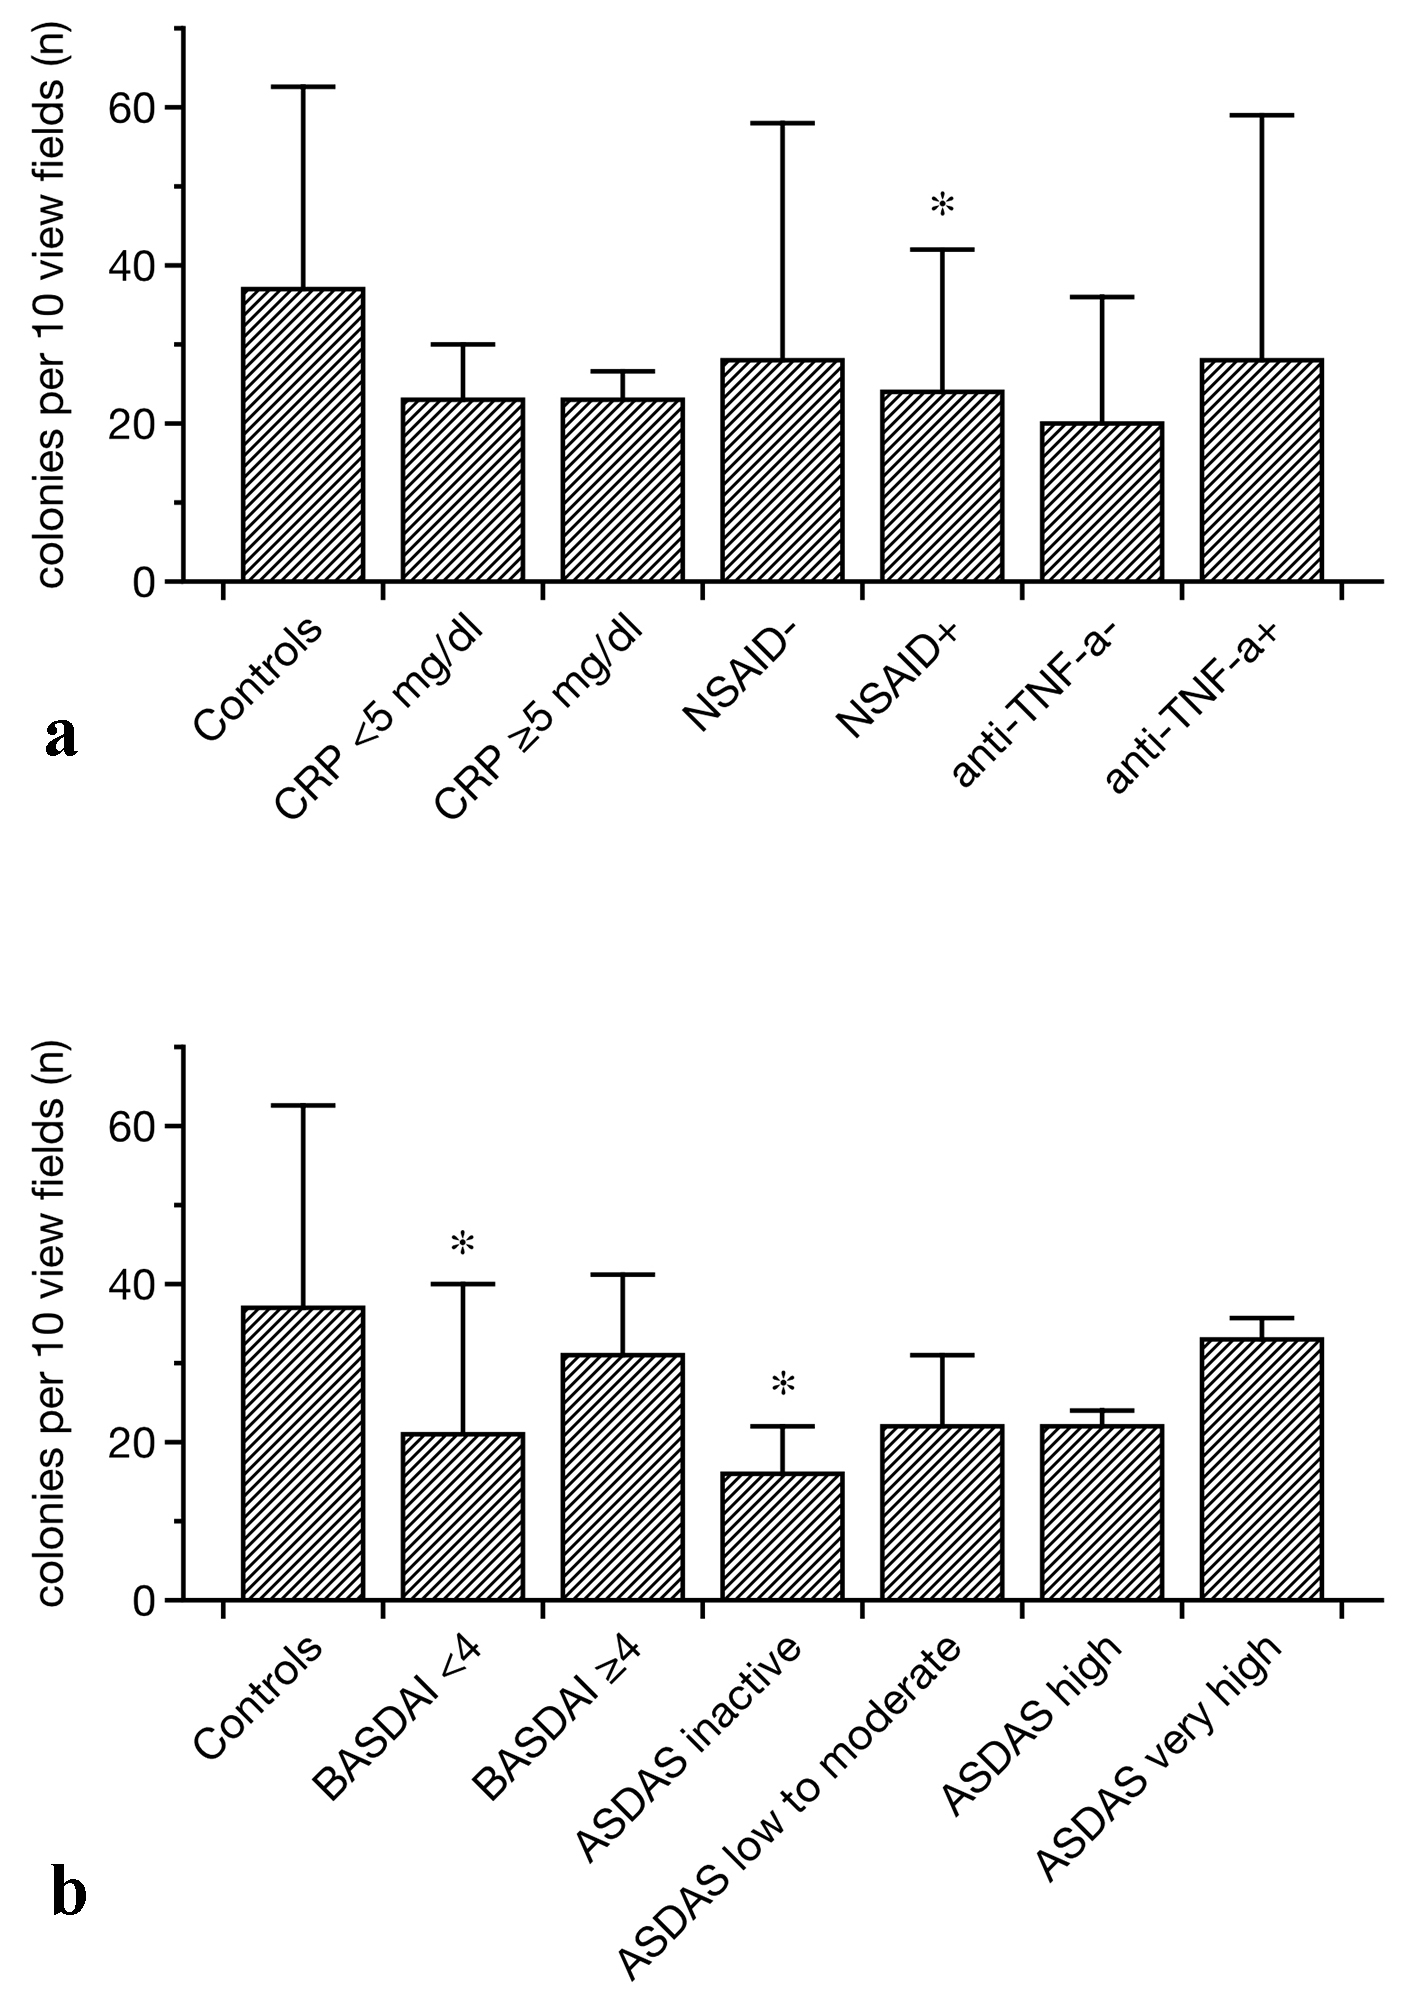
Figure 1. EPC colony formation in controls and SpA patients related to different treatments (a) and disease-associated categories (b). In general, colony numbers were lower in SpA as compared to controls. Particularly patients with a BASDAI of lower than 4 and individuals with the lowest ASDAS displayed impaired EPC colony formation (b). In addition, NSAID treatment was associated with lower than normal colony formation (data as median ± lower and upper quartile, *P < 0.05 as compared to the controls). EPCs: endothelial progenitor cells; SpA: spondylarthritis; BASDAI: Bath ankylosing spondylitis disease activity index; ASDAS: Ankylosing spondylitis disease activity score; NSAIDs: non-steroidal anti-inflammatory drugs.
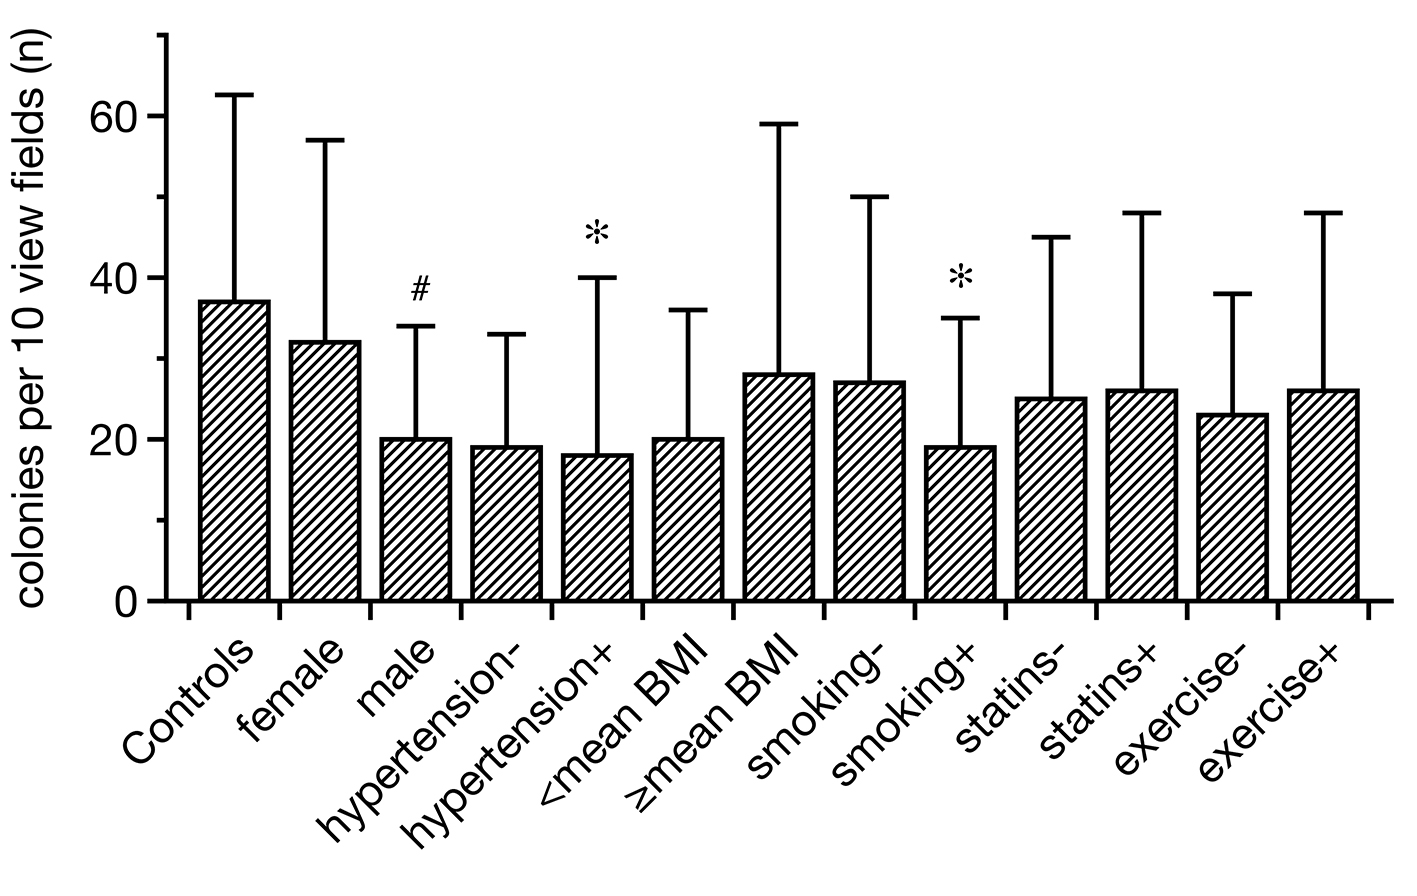
Figure 2. Regenerative activity of EPCs in controls and SpA related to certain CVR factors. Hypertensive and smoking SpA patients displayed lower EPC colonies than healthy subjects. In addition, males showed less intense colony formation than females. All other categories did not differ from each other/the controls in a significant manner (data as median ± lower and upper quartile, *P < 0.05 as compared to the controls; #P < 0.05 between females and males). EPCs: endothelial progenitor cells; SpA: spondylarthritis; CVR: cardiovascular risk.
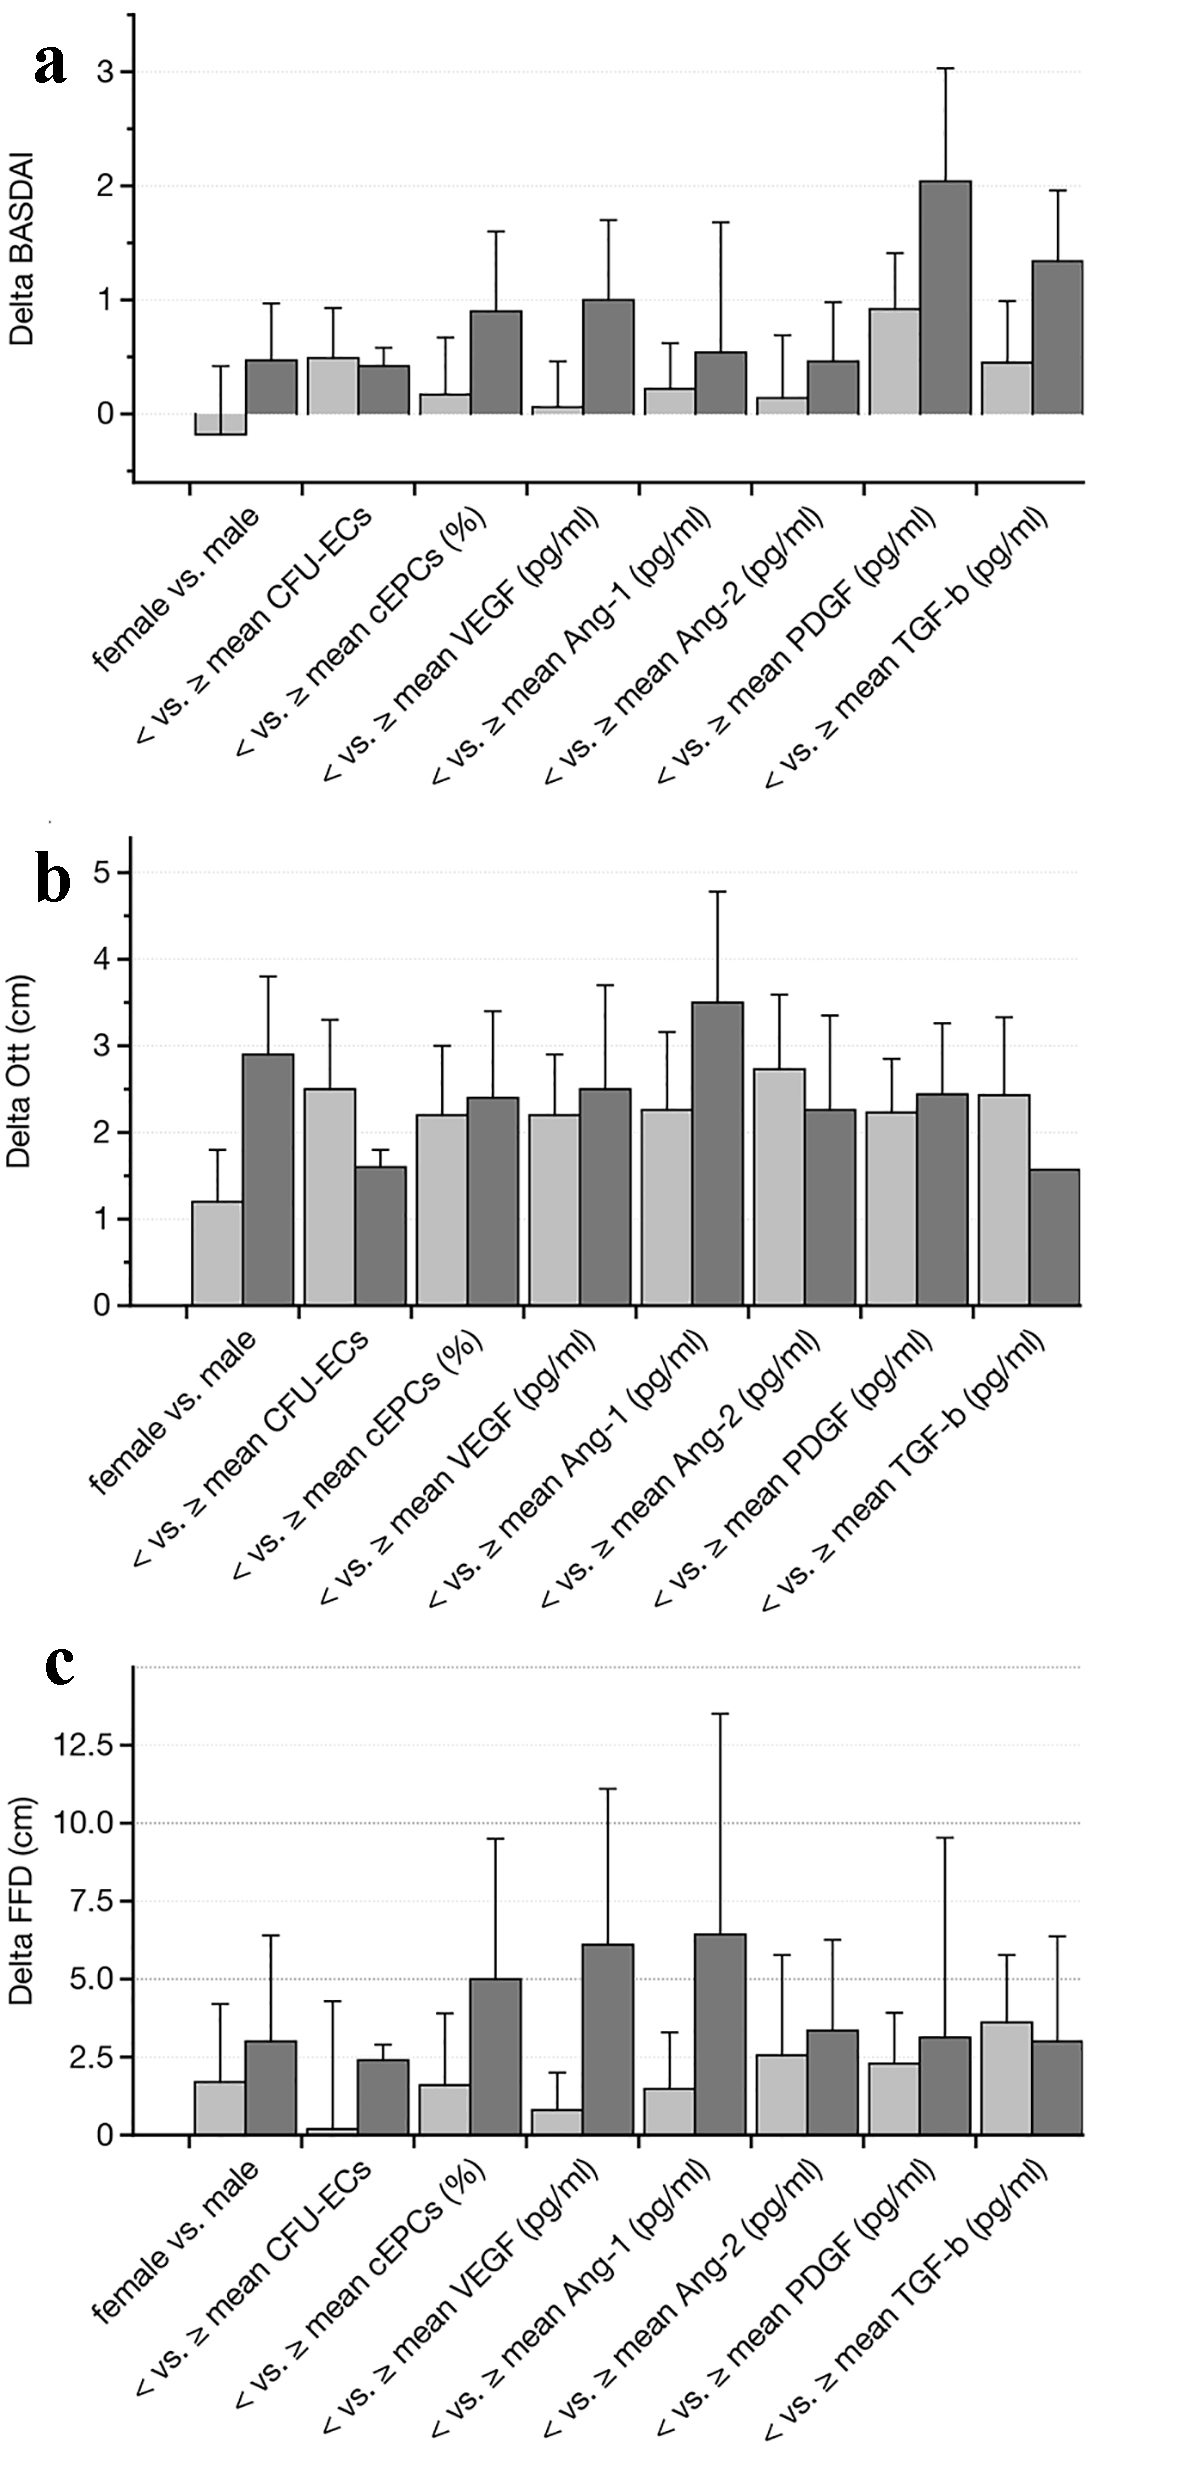
Figure 3. Follow-up analysis after a mean period of 2 years (performed in 34 out of 50 patients (68%)). The parameters including gender, mean number of EPC colonies, peripheral circulating EPCs, and mean serum levels of VEGF, angiopoietin-1 and -2, PDGF and TGF-b were used for comparing differences in BASDAI (a), Ott’ sign (b) and FFD (c) (both in cm) over time. None of the analyzed subgroups showed any significant difference as compared to the beginning of the study (data as median ± lower and upper quartile). EPCs: endothelial progenitor cells; BASDAI: Bath ankylosing spondylitis disease activity index; VEGF: vascular endothelial growth factor; PDGF: platelet-derived growth factor; TGF-b: transforming growth factor-beta; FFD: finger-floor distance.