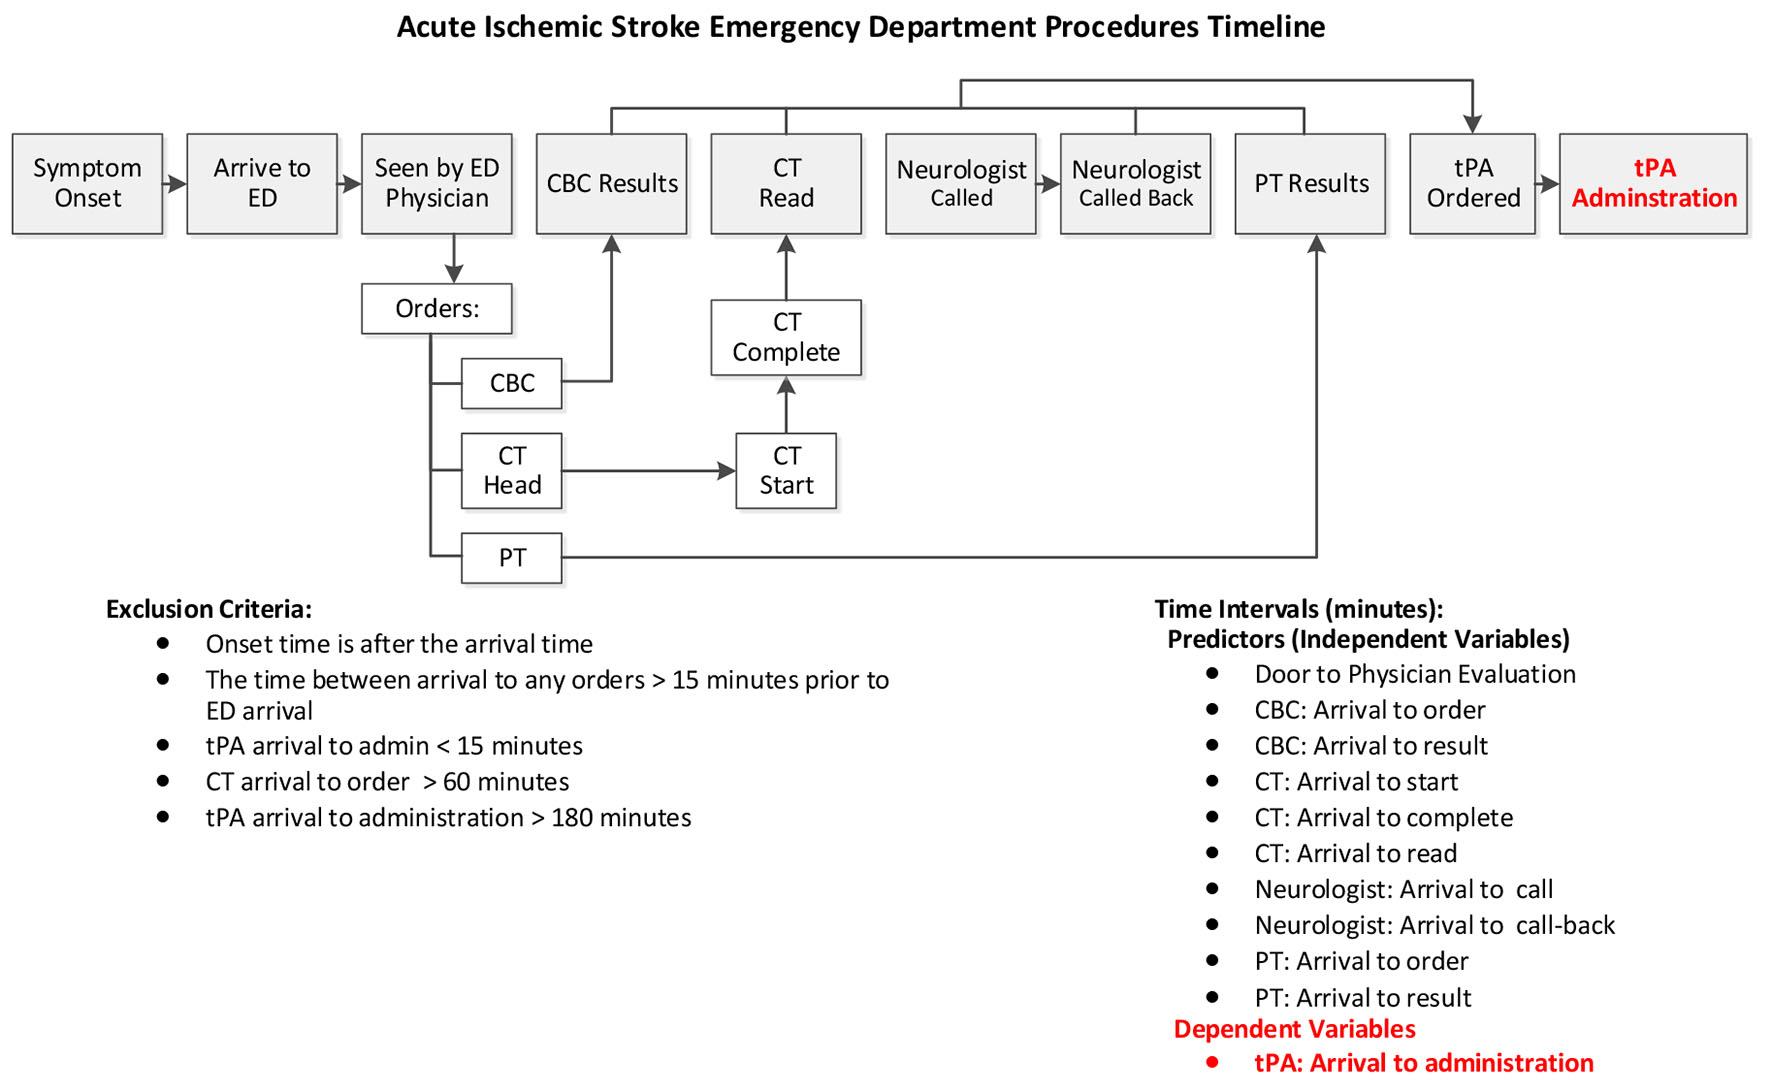
Figure 1. Description of critical event/time frames in the evaluation of candidacy for intravenous thrombolysis.
| Journal of Clinical Medicine Research, ISSN 1918-3003 print, 1918-3011 online, Open Access |
| Article copyright, the authors; Journal compilation copyright, J Clin Med Res and Elmer Press Inc |
| Journal website http://www.jocmr.org |
Original Article
Volume 10, Number 7, July 2018, pages 582-587
Critical Event Intervals in Determining Candidacy for Intravenous Thrombolysis in Acute Stroke
Figures
Tables
| Overall | Received tPA within 60 min | ||||||
|---|---|---|---|---|---|---|---|
| Mean (SD) | N (%) | Yes | No | P-value* | |||
| Mean (SD) | N (%) | Mean (SD) | N (%) | ||||
| SD: standard deviation; tPA: intravenous tissue plasminogen activator; LOS: length of stay. *P-value measures the association between the demographic variables and the receiving of tPA within 60 min. | |||||||
| Age (years) | 65.5 (15.5) | 523 (100.0) | 65.7 (15.0) | 229 (43.9) | 65.3 (15.9) | 294 (56.1) | 0.7722 |
| Hospital LOS (days) | 6.4 (6.0) | 523 (100.0) | 6.5 (6.2) | 229 (44.9) | 6.2 (5.9) | 294 (55.1) | 0.5939 |
| tPA: arrival to drug (min) | 71.2 (28.5) | 523 (100.0) | 47.6 (8.0) | 229 (29.3) | 89.7 (24.9) | 294 (70.7) | |
| The means and standard deviations of arrival to tPA (min) by demographic measures | |||||||
| Arrival year | 0.0005 | ||||||
| 2010 | 75.9 (27.4) | 72 (14.7) | 46.4 (8.3) | 19 (16.1) | 86.5 (23.8) | 53 (83.9) | |
| 2011 | 74.6 (27.9) | 116 (23.2) | 48.4 (8.1) | 45 (25.2) | 91.2 (22.6) | 71 (74.8) | |
| 2012 | 77.0 (33.4) | 111 (22.9) | 48.0 (8.4) | 44 (24.7) | 96.1 (29.7) | 67 (75.3) | |
| 2013 | 65.6 (26.0) | 95 (16.7) | 47.8 (8.0) | 54 (41.4) | 89.0 (22.7) | 41 (58.6) | |
| 2014 | 61.6 (22.5) | 85 (14.1) | 46.7 (8.1) | 47 (41.9) | 80.0 (20.8) | 38 (58.1) | |
| 2015 | 71.1 (28.9) | 44 (8.4) | 47.8 (7.0) | 20 (30.5) | 90.6 (25.5) | 24 (69.5) | |
| Gender | 0.0788 | ||||||
| Female | 73.3 (28.2) | 265 (52.1) | 48.5 (7.6) | 106 (26.4) | 89.9 (24.5) | 159 (73.6) | |
| Male | 69.1 (28.8) | 258 (47.9) | 46.9 (8.3) | 123 (32.3) | 89.4 (25.6) | 135 (67.7) | |
| Race | 0.0396 | ||||||
| Caucasian | 68.8 (27.9) | 312 (57.6) | 47.7 (7.9) | 152 (33.8) | 88.8 (25.3) | 160 (66.2) | |
| African American | 75.5 (29.2) | 188 (38.1) | 47.9 (8.2) | 67 (22.6) | 90.7 (25.1) | 121 (77.4) | |
| Asian | 67.5 (23.1) | 8 (1.5) | 41.3 (5.9) | 3 (23.0) | 83.2 (9.8) | 5 (77.0) | |
| Other | 71.1 (31.3) | 15 (2.9) | 43.9 (9.1) | 7 (28.8) | 95.0 (22.2) | 8 (71.2) | |
| Expired | 0.7408 | ||||||
| Yes | 71.5 (29.8) | 39 (7.5) | 45.6 (9.4) | 16 (26.2) | 89.4 (25.5) | 23 (73.8) | |
| No | 71.2 (28.4) | 484 (92.5) | 47.7 (7.9) | 213 (29.5) | 89.7 (24.9) | 271 (70.5) | |
| Overall | Received tPA within 60 min | |||||
|---|---|---|---|---|---|---|
| N | Mean (SD) | Median | Yes, mean (SD) | No, mean (SD) | P-value* | |
| *Result of logistic regression. CBC: complete blood count; CT: computed tomography; PT: prothrombin time; tPA: tissue plasminogen activator. | ||||||
| Emergency physician: arrival to seen | 523 | 7.1 (6.7) | 5 | 5.8 (3.9) | 8.1 (8.2) | 0.0002 |
| CBC: arrival to order | 494 | 9.5 (8.7) | 7 | 7.1 (4.2) | 11.3 (10.5) | 0.0001 |
| CBC: arrival to results | 494 | 25.0 (14.1) | 21 | 20.6 (7.9) | 28.2 (16.5) | 0.0001 |
| CT: arrival to start | 359 | 13.1 (8.6) | 10 | 10.8 (4.9) | 15.3 (10.5) | 0.00001 |
| CT: arrival to start (imputed) | 523 | 13.0 (8.0) | 10 | 11.1 (4.8) | 14.5 (9.6) | 0.00001 |
| CT: arrival to complete | 285 | 18.4 (15.2) | 14 | 15.9 (13.6) | 20.3 (16.0) | 0.0191 |
| CT: arrival to completed (imputed) | 523 | 19.9 (13.2) | 16 | 17.3 (10.9) | 21.9 (14.4) | 0.00002 |
| CT: arrival to interpretation by radiologist | 467 | 33.4 (16.3) | 30 | 28.2 (10.0) | 36.8 (18.7) | 0.00001 |
| CT: arrival to interpretation by radiologist (imputed) | 523 | 33.7 (16.1) | 31 | 29.7 (11.3) | 36.9 (18.4) | 0.00001 |
| Neurology: arrival to call | 437 | 27.7 (18.4) | 22 | 18.1 (8.6) | 34.9 (20.5) | 0.00001 |
| Neurology: arrival to call back | 419 | 36.9 (19.9) | 31 | 25.5 (9.5) | 45.3 (21.4) | 0.00001 |
| PT: arrival to order | 521 | 10.2 (9.3) | 7 | 7.5 (4.7) | 12.3 (11.3) | 0.00001 |
| PT: arrival to results | 450 | 41.3 (14.3) | 38 | 35.8 (8.2) | 44.6 (16.1) | 0.00001 |
| tPA: arrival to order | 383 | 58.0 (26.5) | 52 | 38.3 (9.7) | 74.5 (24.8) | 0.00001 |
| tPA: prep time | 383 | 12.3 (10.9) | 10 | 9.5 (7.7) | 14.6 (12.6) | 0.00001 |
| tPA: arrival to drug | 523 | 71.2 (28.5) | 65 | 47.6 (8.0) | 89.7 (24.9) | |
| tPA: symptom onset to drug | 514 | 146.9 (45.9) | 141 | 132.7 (50.5) | 158.1 (38.5) | 0.00001 |
| Guideline Recommended Benchmark (min) | Logistic regression results | ||||||||
|---|---|---|---|---|---|---|---|---|---|
| N | AUC | Cut-point (min) | Prob. | Sensitivity | Specificity | PPV | NPV | ||
| CT: computed tomography; tPA: tissue plasminogen activator; PT: prothrombin time; CBC: complete blood count. | |||||||||
| ED physician: arrival to seen | 10 | 523 | 0.543 | 10 | 0.391 | 0.900 | 0.238 | 0.479 | 0.753 |
| CBC: arrival to order | 494 | 0.597 | 13 | 0.343 | 0.923 | 0.281 | 0.485 | 0.833 | |
| CBC: arrival to results | 494 | 0.650 | 19 | 0.487 | 0.598 | 0.653 | 0.558 | 0.689 | |
| CT: arrival to start (imputed) | 25 | 523 | 0.596 | 19 | 0.332 | 0.948 | 0.211 | 0.483 | 0.838 |
| CT: arrival to complete | 285 | 0.574 | 21 | 0.397 | 0.839 | 0.347 | 0.476 | 0.753 | |
| CT: arrival to complete (imputed) | 523 | 0.592 | 23 | 0.409 | 0.852 | 0.296 | 0.485 | 0.719 | |
| CT: arrival to interpretation by radiologist (imputed) | 45 | 523 | 0.601 | 46 | 0.337 | 0.943 | 0.282 | 0.506 | 0.865 |
| Neuro: arrival to Neuro call | 15 | 437 | 0.784 | 26 | 0.391 | 0.852 | 0.593 | 0.615 | 0.840 |
| Neuro: arrival to Neuro call back | 419 | 0.796 | 34 | 0.399 | 0.836 | 0.620 | 0.617 | 0.838 | |
| PT: arrival to order | 521 | 0.607 | 13 | 0.371 | 0.895 | 0.307 | 0.501 | 0.789 | |
| PT: arrival to results | 450 | 0.672 | 37 | 0.413 | 0.647 | 0.607 | 0.500 | 0.739 | |
| tPA: arrival to order | 383 | 0.953 | 53 | 0.370 | 0.966 | 0.818 | 0.816 | 0.966 | |
| tPA: prep time | 383 | 0.622 | 4 | 0.555 | 0.310 | 0.856 | 0.643 | 0.599 | |