Journal of Clinical Medicine Research, ISSN 1918-3003 print, 1918-3011 online, Open Access
Article copyright, the authors; Journal compilation copyright, J Clin Med Res and Elmer Press Inc
Journal website http://www.jocmr.org

Original Article

Volume 10, Number 6, June 2018, pages 466-477


Impact of Dapagliflozin Therapy on Renal Protection and Kidney Morphology in Patients With Uncontrolled Type 2 Diabetes Mellitus

Figures

Figure 1.
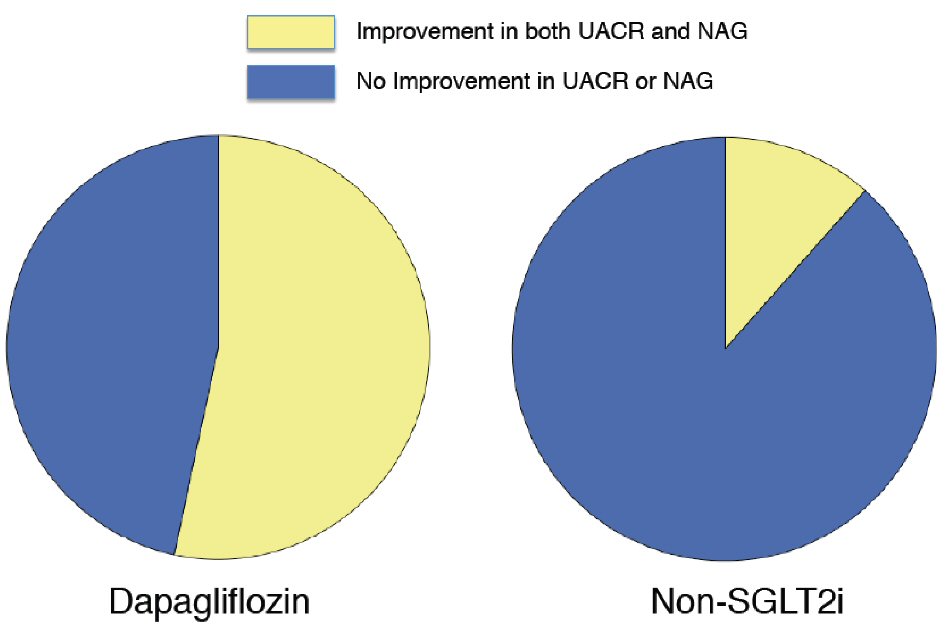
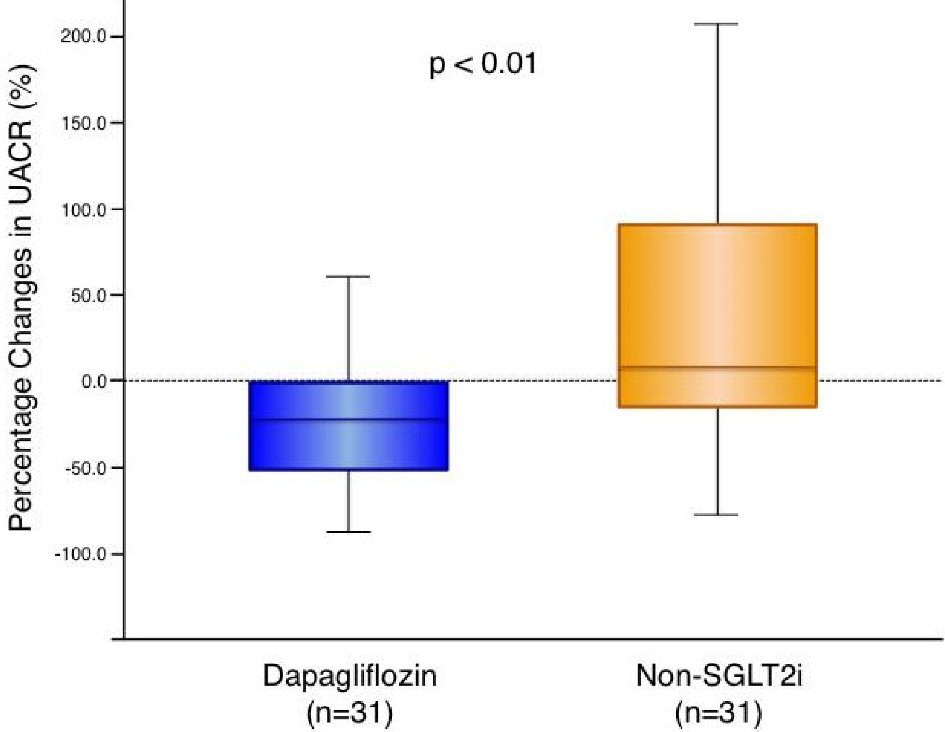
Figure 1. Change in urine albumin-to-creatinine ratio with dapagliflozin therapy and non-SGLT2 inhibitor therapy. Dapagliflozin (n = 31): -21.2 (-52.5 to -1.1) % vs. non-SGLT2i (n = 31): 7.8 (-18.4 to 91.3) %, P = 0.004. Box-and-whisker plots indicate the percentage changes in urine albumin-to-creatinine ratio (UACR) in patients with dapagliflozin therapy (n = 31) or non-sodium-glucose co-transporter 2 (SGLT2) inhibitor therapy (n = 31). In the box-and-whisker plots, lines within boxes represent median values; the top and bottom edges of the boxes represent the 25th and 75th percentiles, respectively; the top and bottom bars outside the boxes represent the 10th and 90th percentiles, respectively. Percentage change in UACR = ((UACR after 6 months of therapy) – (UACR at enrollment)) × 100/(UACR at enrollment). Notably, upon inter-group comparison, the percentage changes in UACR in patients with dapagliflozin therapy were significantly greater than those in the patients with non-SGLT2 inhibitor therapy.
Figure 2.
Figure 2. Proportion of patients with improved urine albumin-to-creatinine ratio and urine N-acetyl-β -glucosaminidase who received dapagliflozin therapy and non-SGLT2 inhibitor therapy. The proportion of patients with an improved urine albumin-to-creatinine ratio (UACR) and urine N-acetyl-β-glucosaminidase (uNAG) was 53.3% in the dapagliflozin group and 11.5% in the non-SGLT2 inhibitor group (P = 0.002). SGLT2i: sodium-glucose co-transporter 2 inhibitor.

Tables

Table 1. Baseline Clinical Characteristics
 
Total patients (n = 62)Dapagliflozin (n = 31)Non-SGLT2i (n = 31)P value
SGLT2i: sodium glucose co-transporter 2 inhibitor; DPP-4: dipeptidyl peptidase; GLP-1: glucagon like peptide-1; eGFR: estimated glomerular filtration ratio; CKD: chronic kidney disease.
Age (years)55.9 ± 8.355.4 ± 8.456.4 ± 8.20.66
Sex (male: %)71.0 %67.7 %74.2 %0.78
Body mass index (kg/m2)27.3 ± 2.927.9 ± 2.626.7 ± 3.00.10
Hypertension (%)72.6 %77.4 %67.7 %0.57
Dyslipidemia (%)72.6 %74.2 %71.0 %1.00
Current smoking (%)22.6 %22.6 %22.6 %1.00
Duration of diabetes (years)10.0 (7.8 - 17.3)10.0 (8.0 - 17.0)11.0 (7.0 - 18.0)0.85
Hemoglobin A1c (%)7.7 (7.3 - 8.4)7.6 (7.3 - 8.1)7.7 (7.2 - 8.6)0.64
Fasting plasma glucose (mg/dL)143.8 ± 39.4136.0 ± 34.0151.6 ± 41.70.12
Anti-diabetic medicines (%)----
  Sulfonylureas (%)27.4 %35.5 %19.4 %0.26
  Glinide (%)12.9 %12.9 %12.9 %1.00
  Metformin (%)96.8 %100.0 %93.5 %0.49
  Alpha-glucosidase inhibitor (%)11.3 %9.7 %12.9 %1.00
  Thiazolidinedione (%)8.1 %12.9 %3.2 %0.35
  DPP-4 inhibitor (%)48.4 %45.2 %51.6 %0.80
  GLP-1 receptor agonist (%)9.7 %12.9 %6.5 %0.67
  Insulin (%)41.9 %29.0 %54.8 %0.07
eGFR (mL/min/1.73m2)76.1 ± 12.577.4 ± 13.874.9 ± 11.10.44
  CKD (eGFR < 60 mL/min/1.73m2) (%)11.3 %9.7 %12.9 %1.00
Albuminuria category (%)----
  Normal (< 30 mg/g) (%)64.5 %67.7 %61.3 %0.79
  Micro albuminuria (30 - 300 mg/g) (%)27.4 %25.8 %29.0 %1.00
  Macro albuminuria (≥ 300 mg/g) (%)8.1 %6.5 %9.7 %1.00


Table 2. Changes in Glucose Metabolic Parameters, Body Weight, Body Composition, and Abdominal Fat Area
 
Dapagliflozin (n = 31)P valueNon-SGLT2i (n = 31)P value
Baseline6 monthsBaseline6 months
SGLT2i: sodium glucose co-transporter 2 inhibitor; HbA1c: hemoglobin A1c; FPG: fasting plasma glucose; VFA: visceral fat area; SFA: subcutaneous fat area; TFA: total fat area; CPR: C-peptide immunoreactivity. The inter-group difference: **P < 0.01, dapagliflozin versus non-SGLT2 inhibitor group.
HbA1c (%)7.6 (7.3 - 8.1)6.8 (6.5 - 7.4)< 0.017.7 (7.2 - 8.6)7.0 (6.6 - 8.0)< 0.01
  Absolute change (%)-1.0 (-1.4 - -0.4)-0.6 (-1.2 - -0.3)
FPG (mg/dL)136.0 ± 36.0116.7 ± 23.1< 0.01151.6 ± 41.7133.6 ± 29.60.01
  Absolute change (mg/dL)-19.2 ± 26.3-18.0 ± 38.6
CPR (ng/mL)2.09 ± 0.951.74 ± 0.78< 0.011.62 ± 0.851.56 ± 0.940.56
  Absolute change (ng/mL)-0.35 ± 0.64-0.05 ± 0.49
Glucagon (pg/mL)151.4 ± 26.0147.0 ± 27.50.404142.1 ± 26.4139.7 ± 27.30.697
  Absolute change (pg/mL)-4.47 ± 28.87-2.43 ± 33.93
Body mass index (kg/m2)27.9 ± 2.626.6 ± 2.7< 0.0126.7 ± 3.026.6 ± 3.10.42
  Absolute change (kg/m2)-1.2 ± 0.9**-0.1 ± 1.0
Body weight (kg)76.8 ± 8.873.3 ± 8.7< 0.0173.0 ± 8.772.6 ± 9.10.44
  Absolute change (kg)-3.5 ± 2.5**-0.4 ± 2.6
Total body fat mass (kg)25.9 ± 6.822.9 ± 7.0< 0.0121.9 ± 6.321.9 ± 6.70.99
  Absolute change (kg)-3.0 ± 2.6**0.0 ± 2.5
Body fat percentage (%)33.6 ± 7.430.9 ± 8.1< 0.0129.9 ± 7.829.9 ± 8.10.87
  Absolute change (%)-2.7 ± 2.9**0.1 ± 2.6
Total body water mass (kg)37.6 ± 5.037.1 ± 5.40.0637.6 ± 5.437.3 ± 5.40.14
  Absolute change (kg)-0.5 ± 1.3-0.3 ± 1.0
Abdominal VFA (cm2)125.3 ± 43.0102.2 ± 41.0< 0.01119.9 ± 55.8117.5 ± 57.10.55
  Absolute change (cm2)-15.9 (-33.5 - -10.1)**-2.9 (-12.4 - 20.5)
Abdominal SFA (cm2)223.0 ± 80.8192.5 ± 82.4< 0.01167.4 ± 61.9169.5 ± 65.00.61
  Absolute change (cm2)-23.3 (-42.3 - -10.1)**-1.1 (-9.6 - 13.2)
Abdominal TFA (cm2)348.3 ± 94.1293.7 ± 95.9< 0.01287.3 ± 85.9287.0 ± 93.60.97
  Absolute change (cm2)-37.1 (-67.0 - -23.5)**1.6 (-22.7 - 24.0)


Table 3. Changes in Lipids, Blood Pressure, Pulse Rate, and BNP
 
Dapagliflozin (n = 31)P valueNon-SGLT2i (n = 31)P value
Baseline6 monthsBaseline6 months
HDL: high density lipoprotein; LDL: low density lipoprotein; NEFA: non-esterified fatty acid; BP: blood pressure; BNP: B-type natriuretic peptide. The inter-group difference: *P < 0.05, dapagliflozin versus non-SGLT2 inhibitor group.
Total cholesterol (mg/dL)153.0 (134.0 - 181.0)147.0 (129.5 - 168.5)0.17160.0 (138.0 - 182.0)147.0 (126.0 - 177.0)0.29
  Absolute change (mm Hg)-4.9 ± 21.4-5.2 ± 26.0
HDL cholesterol (mg/dL)47.3 ± 9.749.7 ± 10.9< 0.0544.4 ± 8.045.4 ± 9.60.38
  Absolute change (mm Hg)2.4 ± 5.81.1 ± 6.6
LDL cholesterol (mg/dL)78.0 (68.0 - 111.0)84.5 (64.8 - 103.0)0.3585.0 (69.0 - 107.0)78.0 (62.0 - 102.0)0.20
  Absolute change (beat/min)-5.5 ± 20.8-5.1 ± 22.5
Triglyceride (mg/mL)97.0 (69.0 - 120.0)73.5 (62.5 - 1.1.3)< 0.01107.0 (83.0 - 162.0)109.0 (70.0 - 156.0)0.17
  Absolute change (mg/mL)-16.5 (-38.8 - 0.5)-3.0 (-20.0 - 5.0)
NEFA (mEq/L)433.0 (287.0 - 615.0)367.0 (258.0 - 499.0)0.49385.0 (327.0 - 488.0)386.0 (314.0 - 490.0)0.93
  Absolute change (mEq/L)-13.0 (-183.0 - 144.0)-8.0 (-60.0 - 83.0)
Systolic BP (mm Hg)133.3 ± 15.3124.8 ± 12.2< 0.01130.2 ± 13.2130.2 ± 16.10.98
  Absolute change (mm Hg)-6.0 (-12.0 - 0.0)*-3.0 (-8.0 - 13.0)
Diastolic BP (mm Hg)80.4 ± 10.475.3 ± 9.5< 0.0176.6 ± 7.476.5 ± 10.40.92
  Absolute change (mm Hg)-5.1 ± 9.0*-0.1 ± 7.3
Pulse rate (beat/min)75.5 ± 7.471.9 ± 8.80.01577.9 ± 12.178.5 ± 11.40.59
  Absolute change (beat/min)-3.6 ± 7.9*0.7 ± 7.0
BNP (pg/mL)8.6 (5.0 - 19.9)7.7 (4.4 - 13.3)0.069.2 (4.6 - 17.8)8.8 (4.3 - 13.9)0.67
  Absolute change (pg/mL)-1.0 (-7.5 - 1.2)-0.2 (-4.4 - 2.6)


Table 4. Changes in Renal Function-Related Factors, and Kidney Length and Radiation Attenuation
 
Dapagliflozin (n = 31)P valueNon-SGLT2i (n = 31)P value
Baseline6 monthsBaseline6 months
eGFR: estimated glomerular filtration ratio; BUN: blood uretic nitrogen; Mg: magnesium; UA: uric acid; UACR: urine albumin-to-creatinine ratio; NAG: N-acetyl-β-glucosaminidase; HU: Hounsfield unit; The inter-group difference: *P < 0.05, **P < 0.01, dapagliflozin versus non-SGLT2 inhibitor group.
eGFR (mL/min/1.73m2)77.4 ± 13.875.4 ± 14.10.1474.9 ±11.174.1 ± 12.20.53
  Absolute change-1.9 ± 7.0-0.8 ± 7.6
Serum creatinine (mg/dL)0.76 ± 0.150.78 ± 0.130.340.79 ± 0.140.80 ± 0.150.49
  Absolute change (mg/dL)0.03 (-0.04 - 0.06)0.00 (-0.04 - 0.05)
Serum BUN (mg/dL)12.5 (11.0 - 14.2)13.2 (11.0 - 15.1)0.2211.4 (10.0 - 13.7)12.3 (9.7 - 15.1)0.42
  Absolute change (mg/dL)0.6 ± 2.80.6 ± 3.3
Serum Mg (mg/dL)2.17 ± 0.192.32 ± 0.17< 0.012.19 ± 0.222.15 ± 0.250.31
  Absolute change (mg/dL)0.2 (0.0 - 0.3)**-0.1 (-0.2 - 0.1)
Serum UA (mg/dL)5.2 ± 1.34.5 ± 1.1< 0.015.1 ± 1.25.2 ± 1.10.53
  Absolute change (mg/dL)-0.5 (-1.0 - 0.0)**0.1 (-0.4 - 0.6)
Daily salt intake (g/day)9.5 ± 2.19.3 ± 2.30.679.7 ± 2.39.9 ± 2.70.62
  Absolute change (g/day)-0.2 ± 2.80.3 ± 3.0
UACR (mg/g)15.7 (7.6 - 71.0)7.5 (5.5 - 37.4)< 0.0125.8 (4.4 - 44.3)16.8 (7.4 - 45.1)0.43
  Absolute change (mg/g)-3.7 (-12.8 - -0.1)*0.82 (-4.7 - 8.6)
Urine NAG (U/L)8.9 (6.6 - 12.2)6.7 (3.2 - 8.3)< 0.016.5 (3.8 - 14.3)5.8 (2.9 - 15.8)0.69
  Absolute change (U/L)-3.1 (-6.1 - 0.6)*0.2 (-3.0 - 5.1)
Kidney length (mm)104.4 ± 8.3107.9 ± 8.5< 0.01103.3 ± 9.0102.9 ± 8.50.62
  Absolute change (mm)3.5 ± 5.9**-0.4 ± 3.7
Kidney radiation attenuation (HU)35.9 (34.6 - 37.6)36.8 (35.2 - 39.3)0.02636.0 (34.6 - 38.2)35.5 (34.6 - 37.7)0.56
  Absolute change (HU)0.98 ± 2.49-0.13 ± 3.37


Table 5. Logistic Regression Analysis for the Improvement of Urine Albumin-to-Creatinine Ratio Among Baseline Factors
 
Baseline VariableUnivariate logistic regressionMultivariate logistic regressionusing forced inclusion model
OR95% CIPOR95% CIP
OR: odds ratio; CI: confidence interval; FPG: fasting plasma glucose; CPR: C-peptide immunoreactivity; VFA: visceral fat area; SFA: subcutaneous fat area; TFA: total fat area; HU: Hounsfield unit. Hosmer-Lemeshow P = 0.587 in multivariate analysis.
Age (per year)0.9290.864 to 0.9970.0420.9170.844 to 0.9970.042
Gender (male)0.6580.209 to 2.0720.474-
Body mass index (per 1.0 kg/m2)1.1520.954 to 1.3890.141-
Body weight (per 1.0; kg)1.0510.988 to 1.1190.111-
Waist circumference (per 1.0; cm)1.0861.003 to 1.1760.0421.0780.962 to 1.2080.197
Total body fat mass (per 1.0; kg)1.0760.991 to 1.1680.080-
Body fat percentage (per 1.0; %)1.0480.978 to 1.1220.181-
Hypertension (yes)0.3520.099 to 1.2450.105-
Dyslipidemia (yes)0.7460.235 to 2.3750.620-
Current smoker (yes)1.2860.374 to 4.4190.690-
Hemoglobin A1c (per 1.0; %)1.2740.730 to 2.2170.394-
FPG (per 1.0; mg/dL)1.0030.990 to 1.0160.639-
CPR (per 1.0; ng/mL)1.7360.923 to 2.7020.086-
Glucagon (per 1.0; pg/mL)1.0160.995 to 1.0370.139-
Duration (per 1.0; years)1.0090.929 to 1.0940.837-
Abdominal VFA (per 1.0; cm2)0.9980.988 to 1.0090.755-
Abdominal SFA (per 1.0; cm2)1.0081.000 to 1.0150.0490.9980.987 to 1.0090.760
Abdominal TFA (per 1.0; cm2)1.0040.999 to 1.0100.143-
Kidney length (per 1.0; mm)0.9880.931 to 1.0490.698-
Kidney attenuation (per 1.0; HU)1.0000.849 to 1.1760.995-
Dapagliflozin therapy (yes)4.7391.574 to 14.2850.0154.5051.309 to 15.6250.016


Table 6. Correlation Between Percent Changes in Urine Albumin-to-Creatinine Ratio and Changes in Clinical Variables
 
Spearman’sP value
LnRHI: natural logarithmic transformation of reactive-hyperemia index; CPR: C-peptide immunoreactivity; TG: triglyceride; NEFA: non-esterified free fatty acid; BNP: B-type natriuretic peptide; NAG: N-acetyl-β-glucosaminidase; TFA: total fat area; VFA: visceral fat area; SFA: subcutaneous fat area; HU: Hounsfield unit. *P < 0.05, **P < 0.01.
Changes in hemoglobin A1c (%)0.1130.368
Changes in fasting blood glucose (mg/dL)0.2340.067
Changes in fasting blood CPR (ng/mL)0.0450.733
Changes in fasting blood glucagon (pg/mL)**0.3660.004
Changes in body mass index (kg/m2)0.2210.084
Changes in body in body weight (kg)0.2230.082
Changes in waist circumference (cm)0.2280.074
Changes in total body fat mass (kg)*0.2810.027
Changes in body fat percentage (%)*0.2600.041
Changes in total body water mass (kg)-0.1410.275
Changes in SFA (cm2)0.2110.100
Changes in VFA (cm2)0.0330.799
Changes in TFA (cm2)0.1120.385
Changes in systolic blood pressure (mm Hg)0.1980.122
Changes in diastolic blood pressure (mm Hg)0.1350.294
Changes in pulse rate (per min)0.0360.784
Changes in BNP (pg/mL)-0.0180.888
Changes in urine NAG (U/L)-0.0160.905
Changes in kidney length (mm)-0.1720.182
Changes in kidney radiation attenuation (HU)-0.0780.547