| Age (years) (mean ± SD) | 56.7 ± 11.0 | 57.2 ± 11.6 | 56.2 ± 10.6 | 0.7824 |
| Sex (males, %) | 85.7 | 88.9 | 82.4 | 0.5808 |
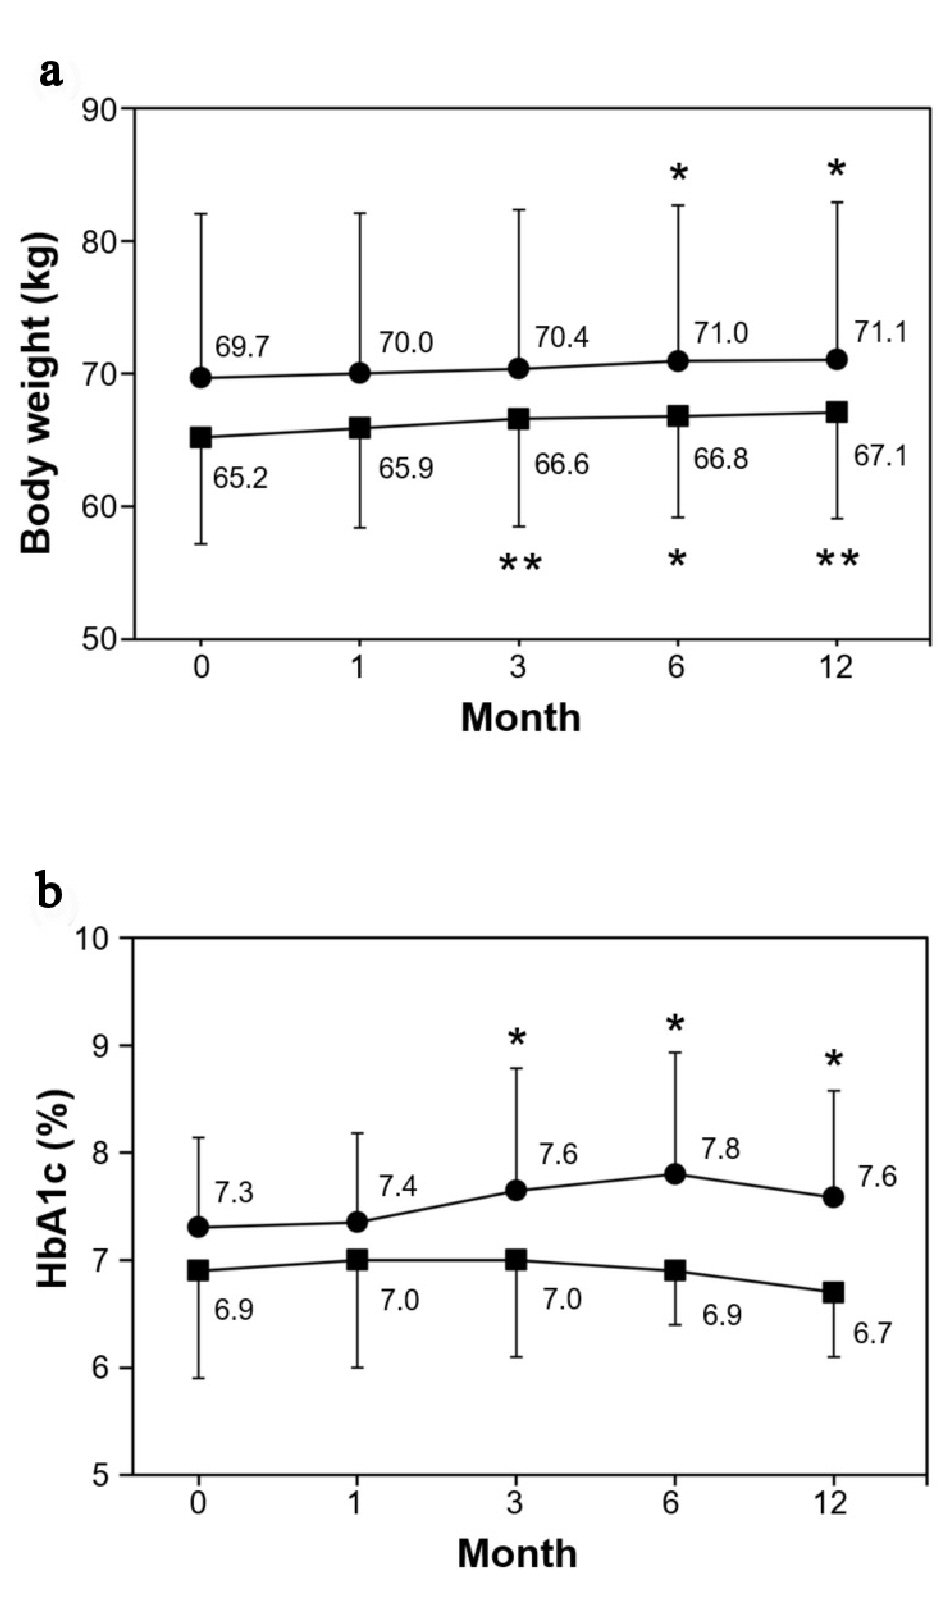
| Body weight (kg) (mean ± SD) | 67.4 ± 10.4 | 65.2 ± 8.0 | 69.7 ± 12.4 | 0.2100 |
| BMI (kg/m2) (mean ± SD) | 24.9 ± 3.9 | 24.6 ± 3.4 | 25.2 ± 4.4 | 0.6532 |
| Diabetes onset (years) (median (IQR)) | 46 (36 - 50) | 48.5 (34.3 - 51.3) | 43 (36.5 - 48) | 0.8920 |
| Diabetes duration (years) (median (IQR)) | 12 (6 - 21) | 13 (6.8 - 20.3) | 12 (5.5 - 22) | 0.6105 |
| HbA1c (%) (mean ± SD) | 7.1 ± 0.9 | 6.9 ± 1.0 | 7.3 ± 0.8 | 0.2343 |
| Insulin (%) | 51.4 | 55.6 | 47.1 | 0.6152 |
| Number of OADs (median (IQR)) | 1 (0 - 2) | 1 (0 - 2) | 1 (0 - 2.5) | 0.7531 |
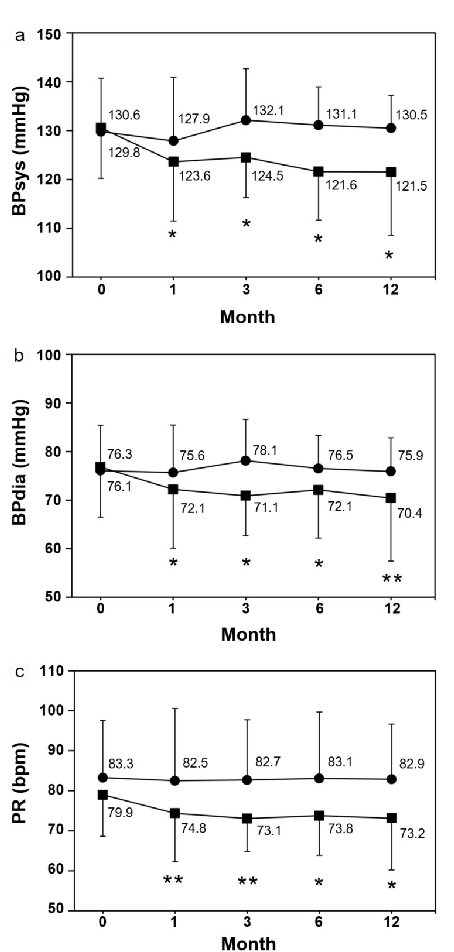
| Systolic BP (mm Hg) (mean ± SD) | 130.2 ± 10.3 | 130.6 ± 9.9 | 129.8 ± 11.0 | 0.8239 |
| Diastolic BP (mm Hg) (mean ± SD) | 76.2 ± 9.1 | 76.3 ± 9.2 | 76.1 ± 9.3 | 0.9447 |
| Pulse rate (bpm) (mean ± SD) | 81.5 ± 12.1 | 79.9 ± 9.7 | 83.3 ± 14.3 | 0.4125 |
| Antihypertensive medication (%) | 51.4 | 50.0 | 52.9 | 0.8619 |
| eGFR (mL/min/1.73m2) (mean ± SD) | 69.8 ± 17.8 | 67.8 ± 21.6 | 72.0 ± 13.0 | 0.4926 |
| Proteinuria (%) | 51.4 | 55.6 | 47.1 | 0.6150 |
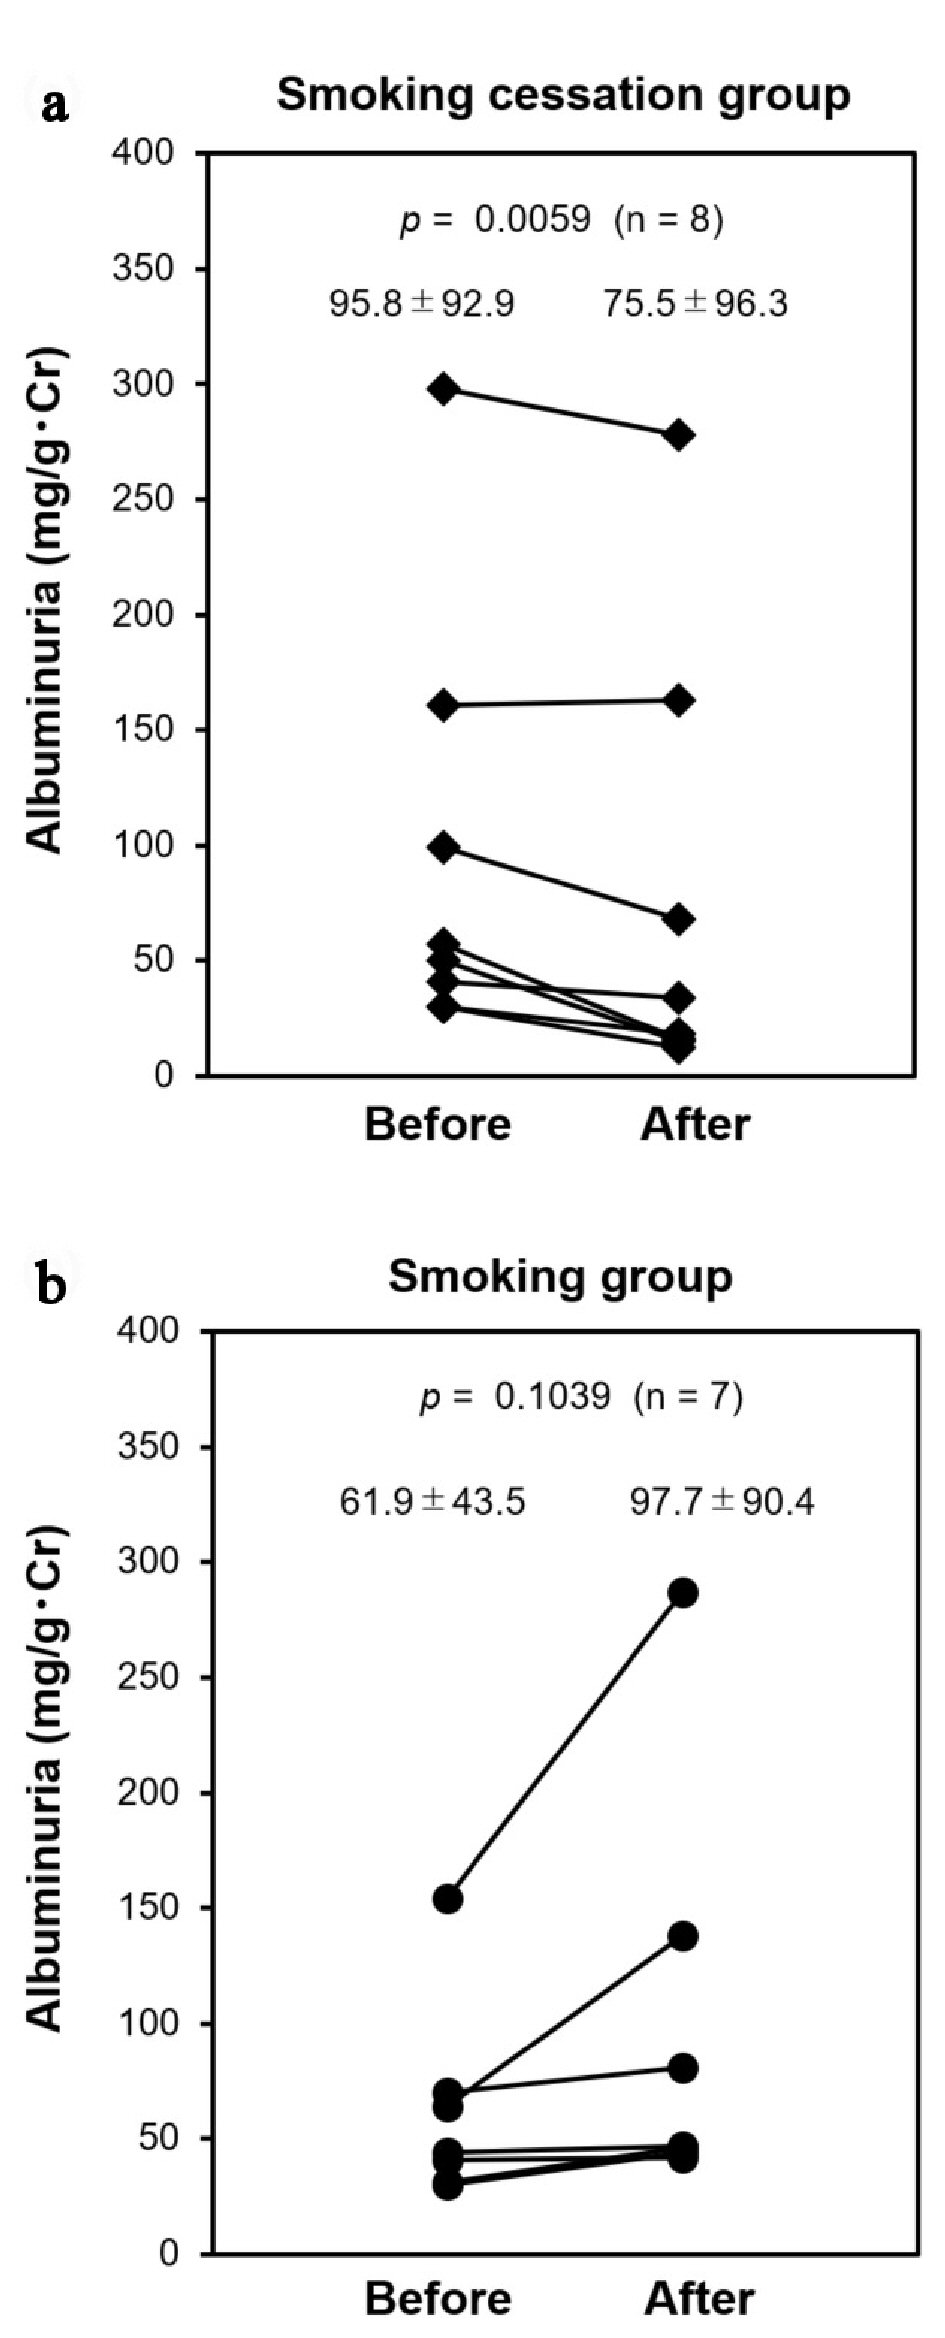
| Microalbuminuria (%) | 42.9 | 44.4 | 36.4 | 0.8452 |
| Pack-years (median (IQR)) | 41.0 (28.0 - 64.8) | 43.0 (24.5 - 65.8) | 39.0 (29.0 - 61.5) | 0.7672 |
| Cigarettes/day (median (IQR)) | 20.0 (20.0 - 30.0) | 20.0 (20.0 - 31.3) | 20.0 (20.0 - 32.5) | 0.4547 |
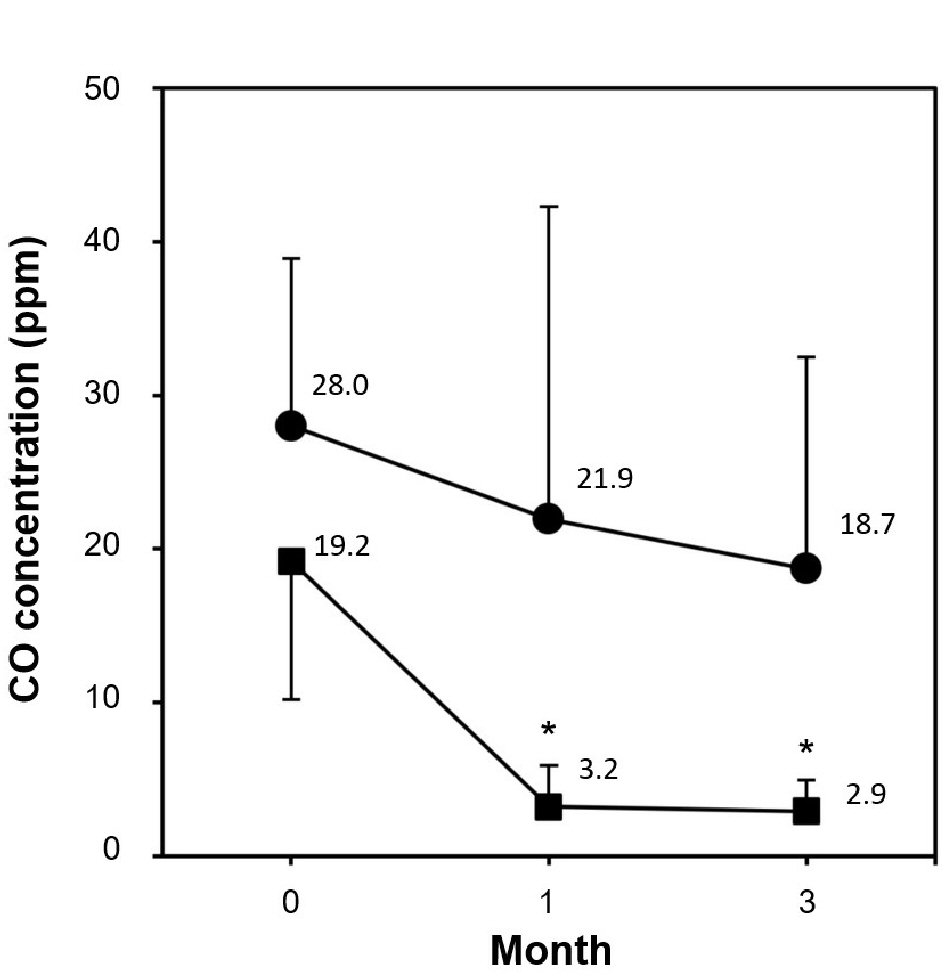
| Expiratory CO (ppm) (mean ± SD) | 23.5 ± 11.2 | 19.2 ± 9.8 | 28.0 ± 10.9 | 0.0169† |
| FTND (median (IQR)) | 6.0 (4.0 - 7.0) | 4.5 (2.3 - 6.8) | 7.0 (6.0 - 7.5) | 0.0066‡ |
| TDS (median (IQR)) | 8.0 (7.0 - 9.0) | 8.0 (5.0 - 8.5) | 9.0 (8.0 - 10.0) | 0.0020‡ |
| Housemate smoking (%) | 20.0 | 11.1 | 29.4 | 0.1761 |
| Psychiatric treatment (%) | 37.1 | 22.2 | 52.9 | 0.0601 |