| N | 235 |
| Age (y/o) | 67.4 ± 11.1 |
| Gender (male/female) | 109/126 |
| Etiology (HCV/HBV/alcohol/NASH/others) | 148/27/25/15/20 |
| BMI (kg/m2) | 23.8 ± 4.1 |
| Daily alcohol intake (none/< 60 g/≥ 60 g) | 179/25/23 |
| Platelets count (× 103/mm3) | 102.9 ± 64.4 |
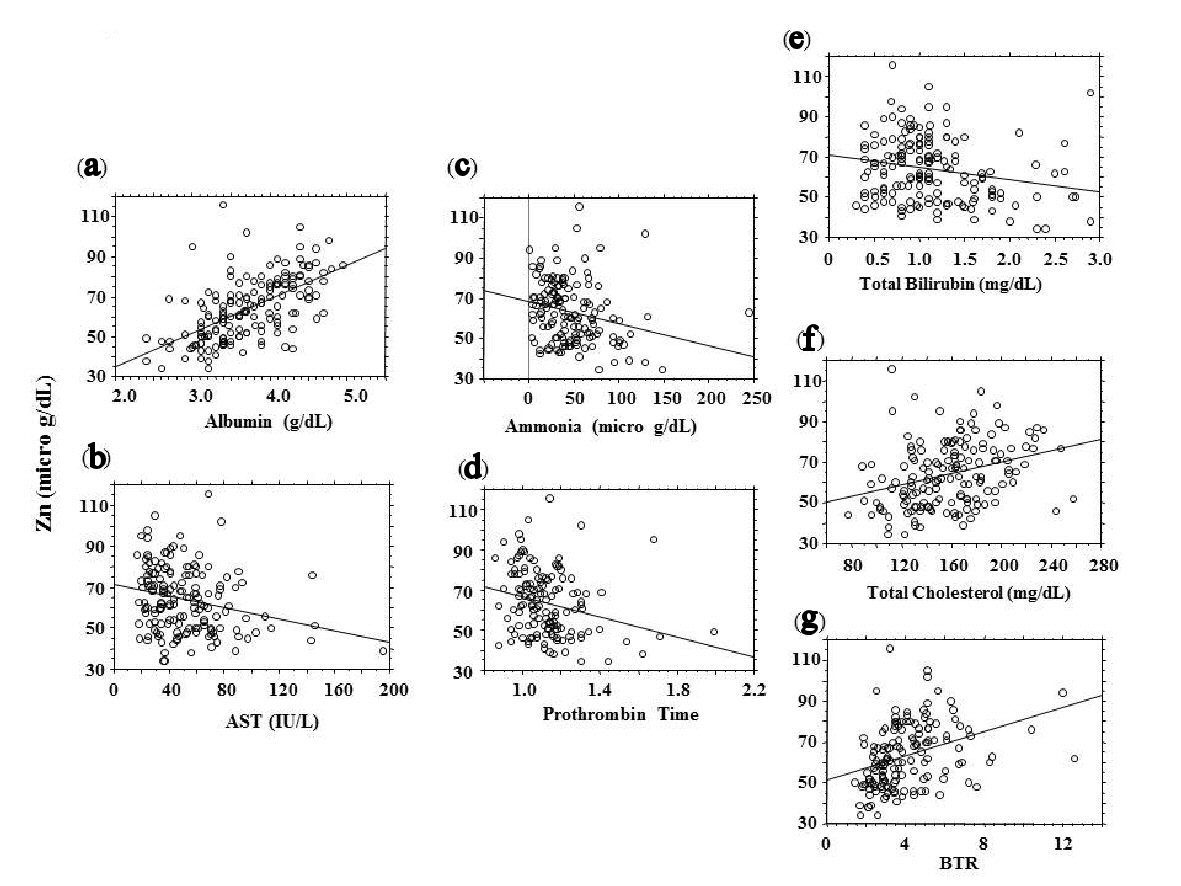
| AST (IU/L) | 52.0 ± 32.1 |
| ALT (IU/L) | 41.8 ± 29.4 |
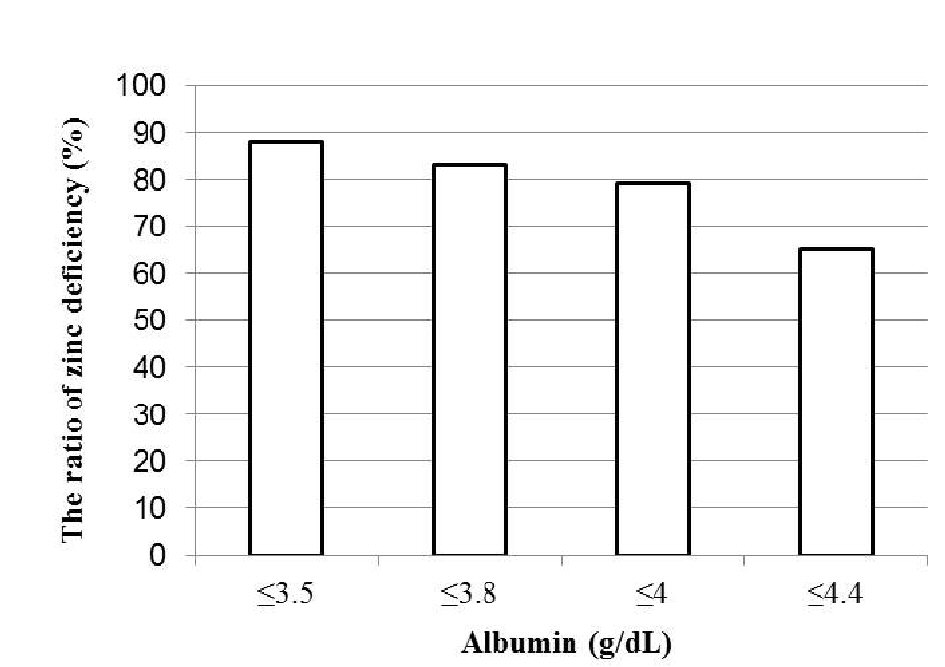
| Albumin (g/dL) | 3.67 ± 0.53 |
| Total bilirubin (mg/dL) | 1.10 ± 0.53 |
| Prothrombin time (international normalized ratio) | 1.13 ± 0.18 |
| Creatinine (mg/dL) | 0.90 ± 1.30 |
| BUN (mg/dL) | 16.4 ± 10.8 |
| BCAA-to-tyrosine ratio (BTR) | 3.97 ± 1.77 |
| Child-Pugh score | 6.03 ± 1.15 |
| Ammonia (µg/dL) | 48.7 ± 33.5 |
| Total cholesterol (mg/dL) | 157.9 ± 33.5 |
| Triglycerides (mg/dL) | 93.4 ± 49.6 |
| Fasting blood glucose (mg/dL) | 114.8 ± 31.7 |
| HbA1c (%) | 5.50 ± 1.03 |
| HOMA-IR | 5.71 ± 8.86 |
| Zinc (µg/dL) | 64.1 ± 15.8 |
| Ferritin (ng/mL) | 168.2 ± 522.0 |
| AFP (ng/mL) | 18.1 ± 37.4 |
| Edema, ascites (+/-) | 46/187 |
| Administration of diuretics (+/-) | 78/157 |
| Administration of BCAA (+/-) | 78/157 |
| Administration of oral DM agents (+/-) | 56/179 |
| Administration of insulin (+/-) | 22/213 |