Figures
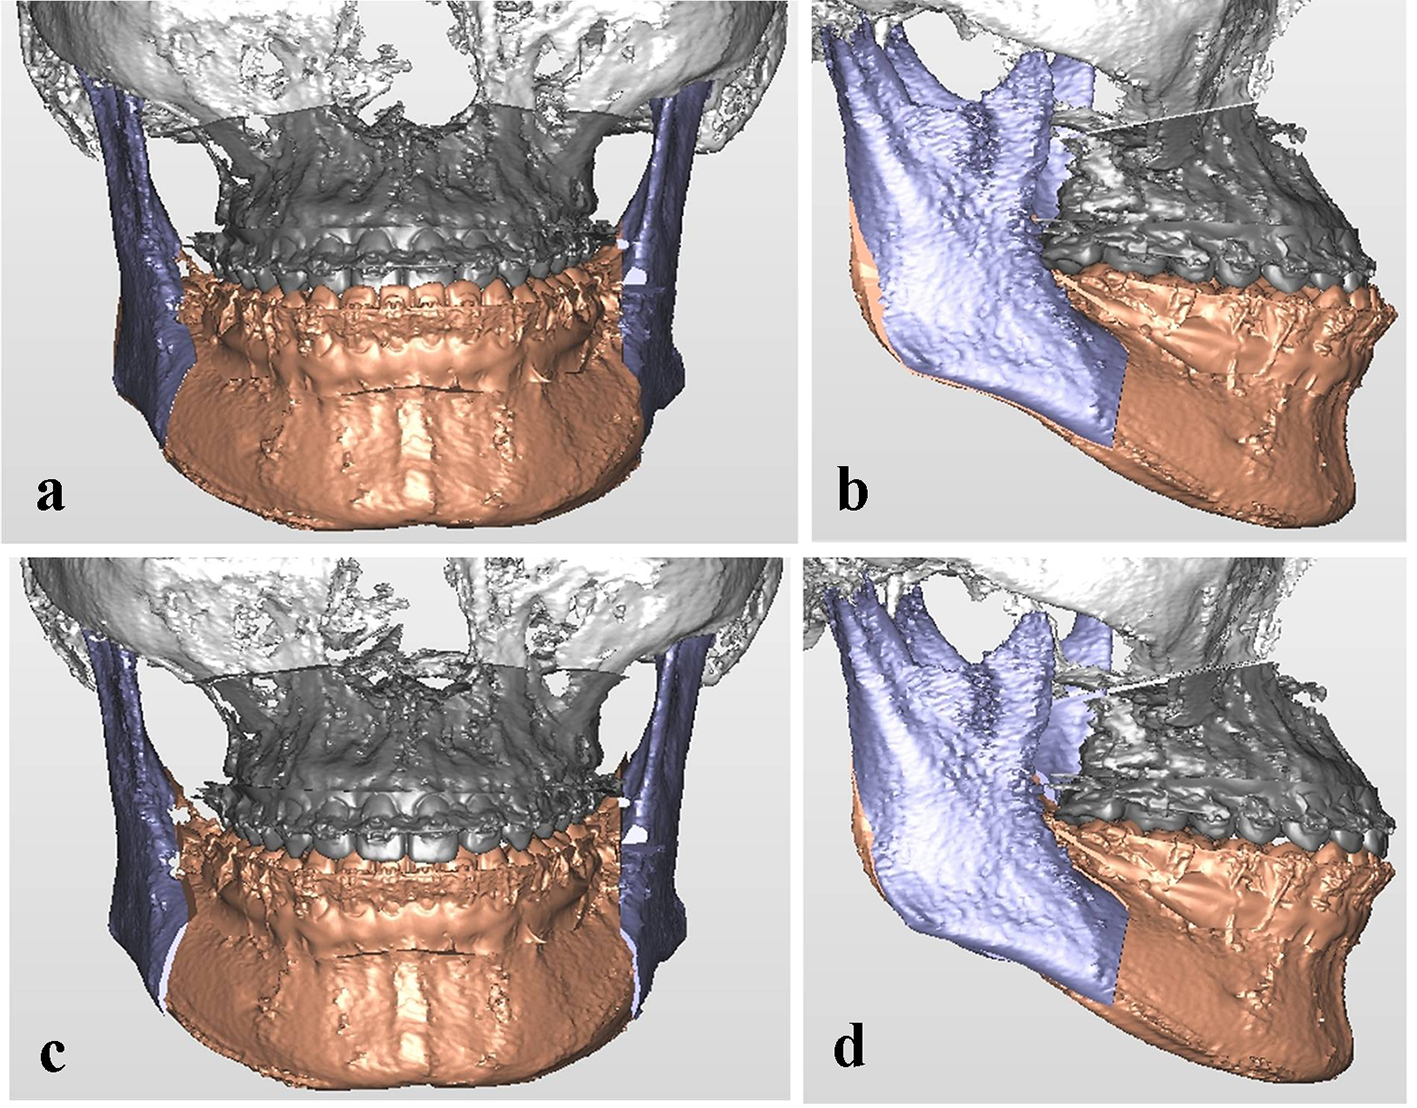
Figure 1. Virtual surgical planning of a 25-year-old male with skeletal Class III malocclusion, retrognathic maxilla, prognathic mandible. (a, b) Preoperative: cutting lines of Le Fort I osteotomy and BSSO were designed. (c, d) Planned postoperative reposition of maxillary and mandibular distal segments.
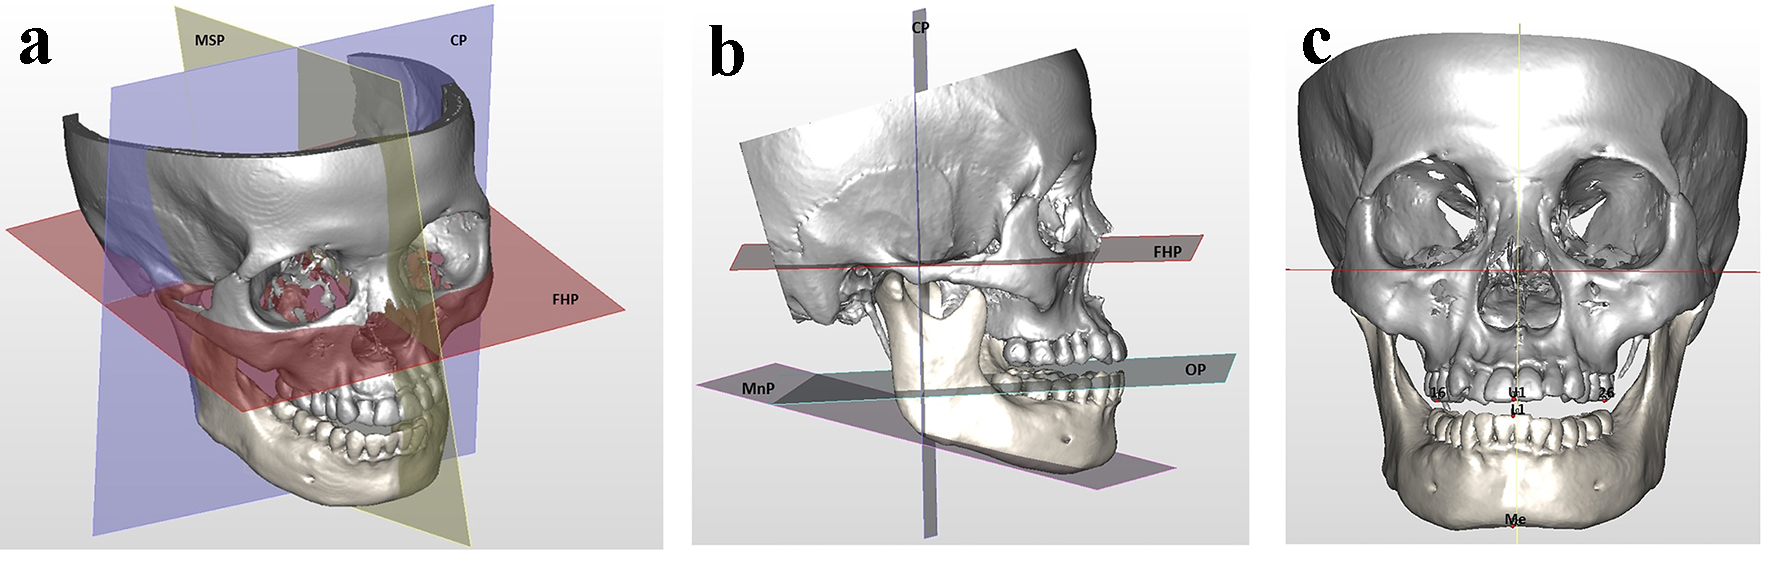
Figure 2. Symmetry planes and landmarks on the surface of the skull. (a) FHP: Frankfort horizontal plane; MSP: midsagittal plane; CP: coronal plane. (b) OP: occlusal plane; MnP: mandibular plane. (c) U1: midpoint of the contact of the upper central incisors; L1: midpoint of the contact of the lower central incisors; 16 and 26: mesiobuccal cusp tips of the upper first molars; Me: menton.
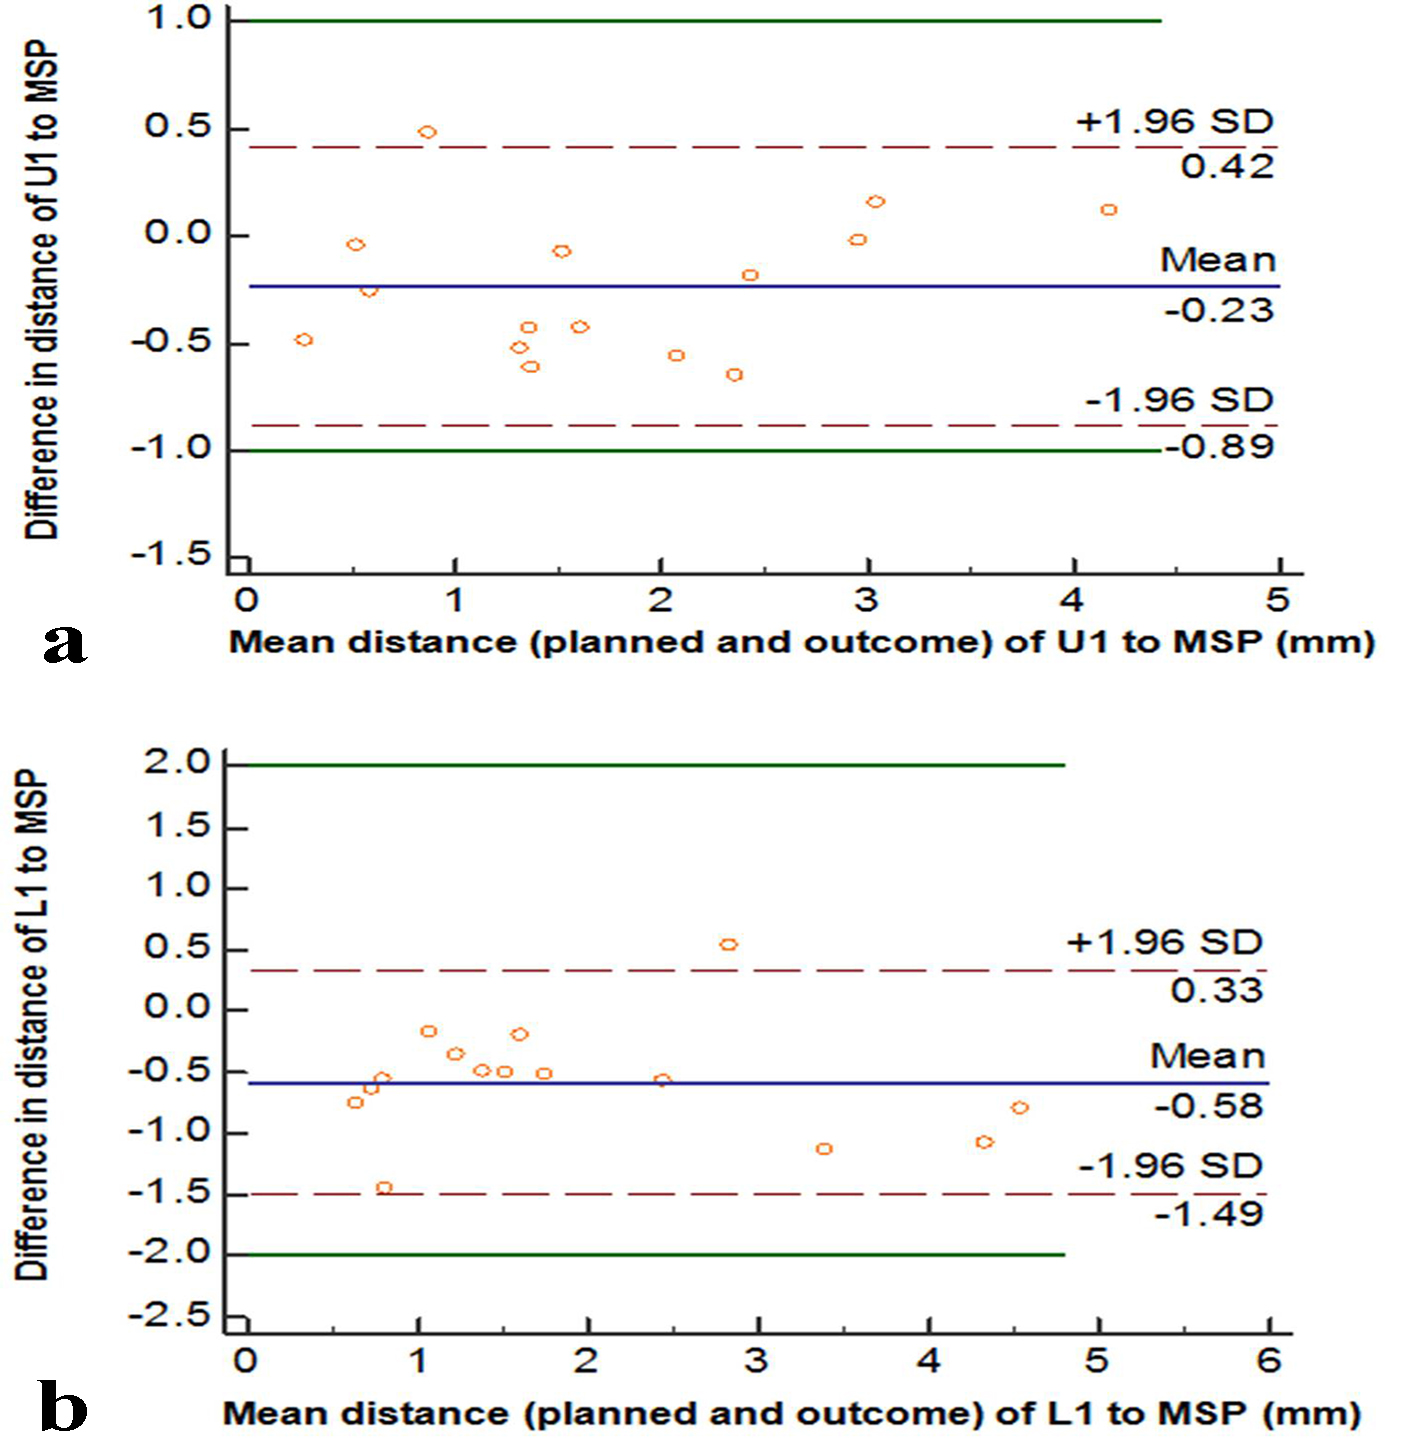
Figure 3. The Bland-Altman plots evaluating variation of difference in measurement between simulation and actual outcome regarding distance from U1 to MSP (a) and L1 to MSP (b). The value is represented as mean ± 1.96 SDs. Maximum allowed differences were set at 1 mm (a) and 2 mm (b), respectively.
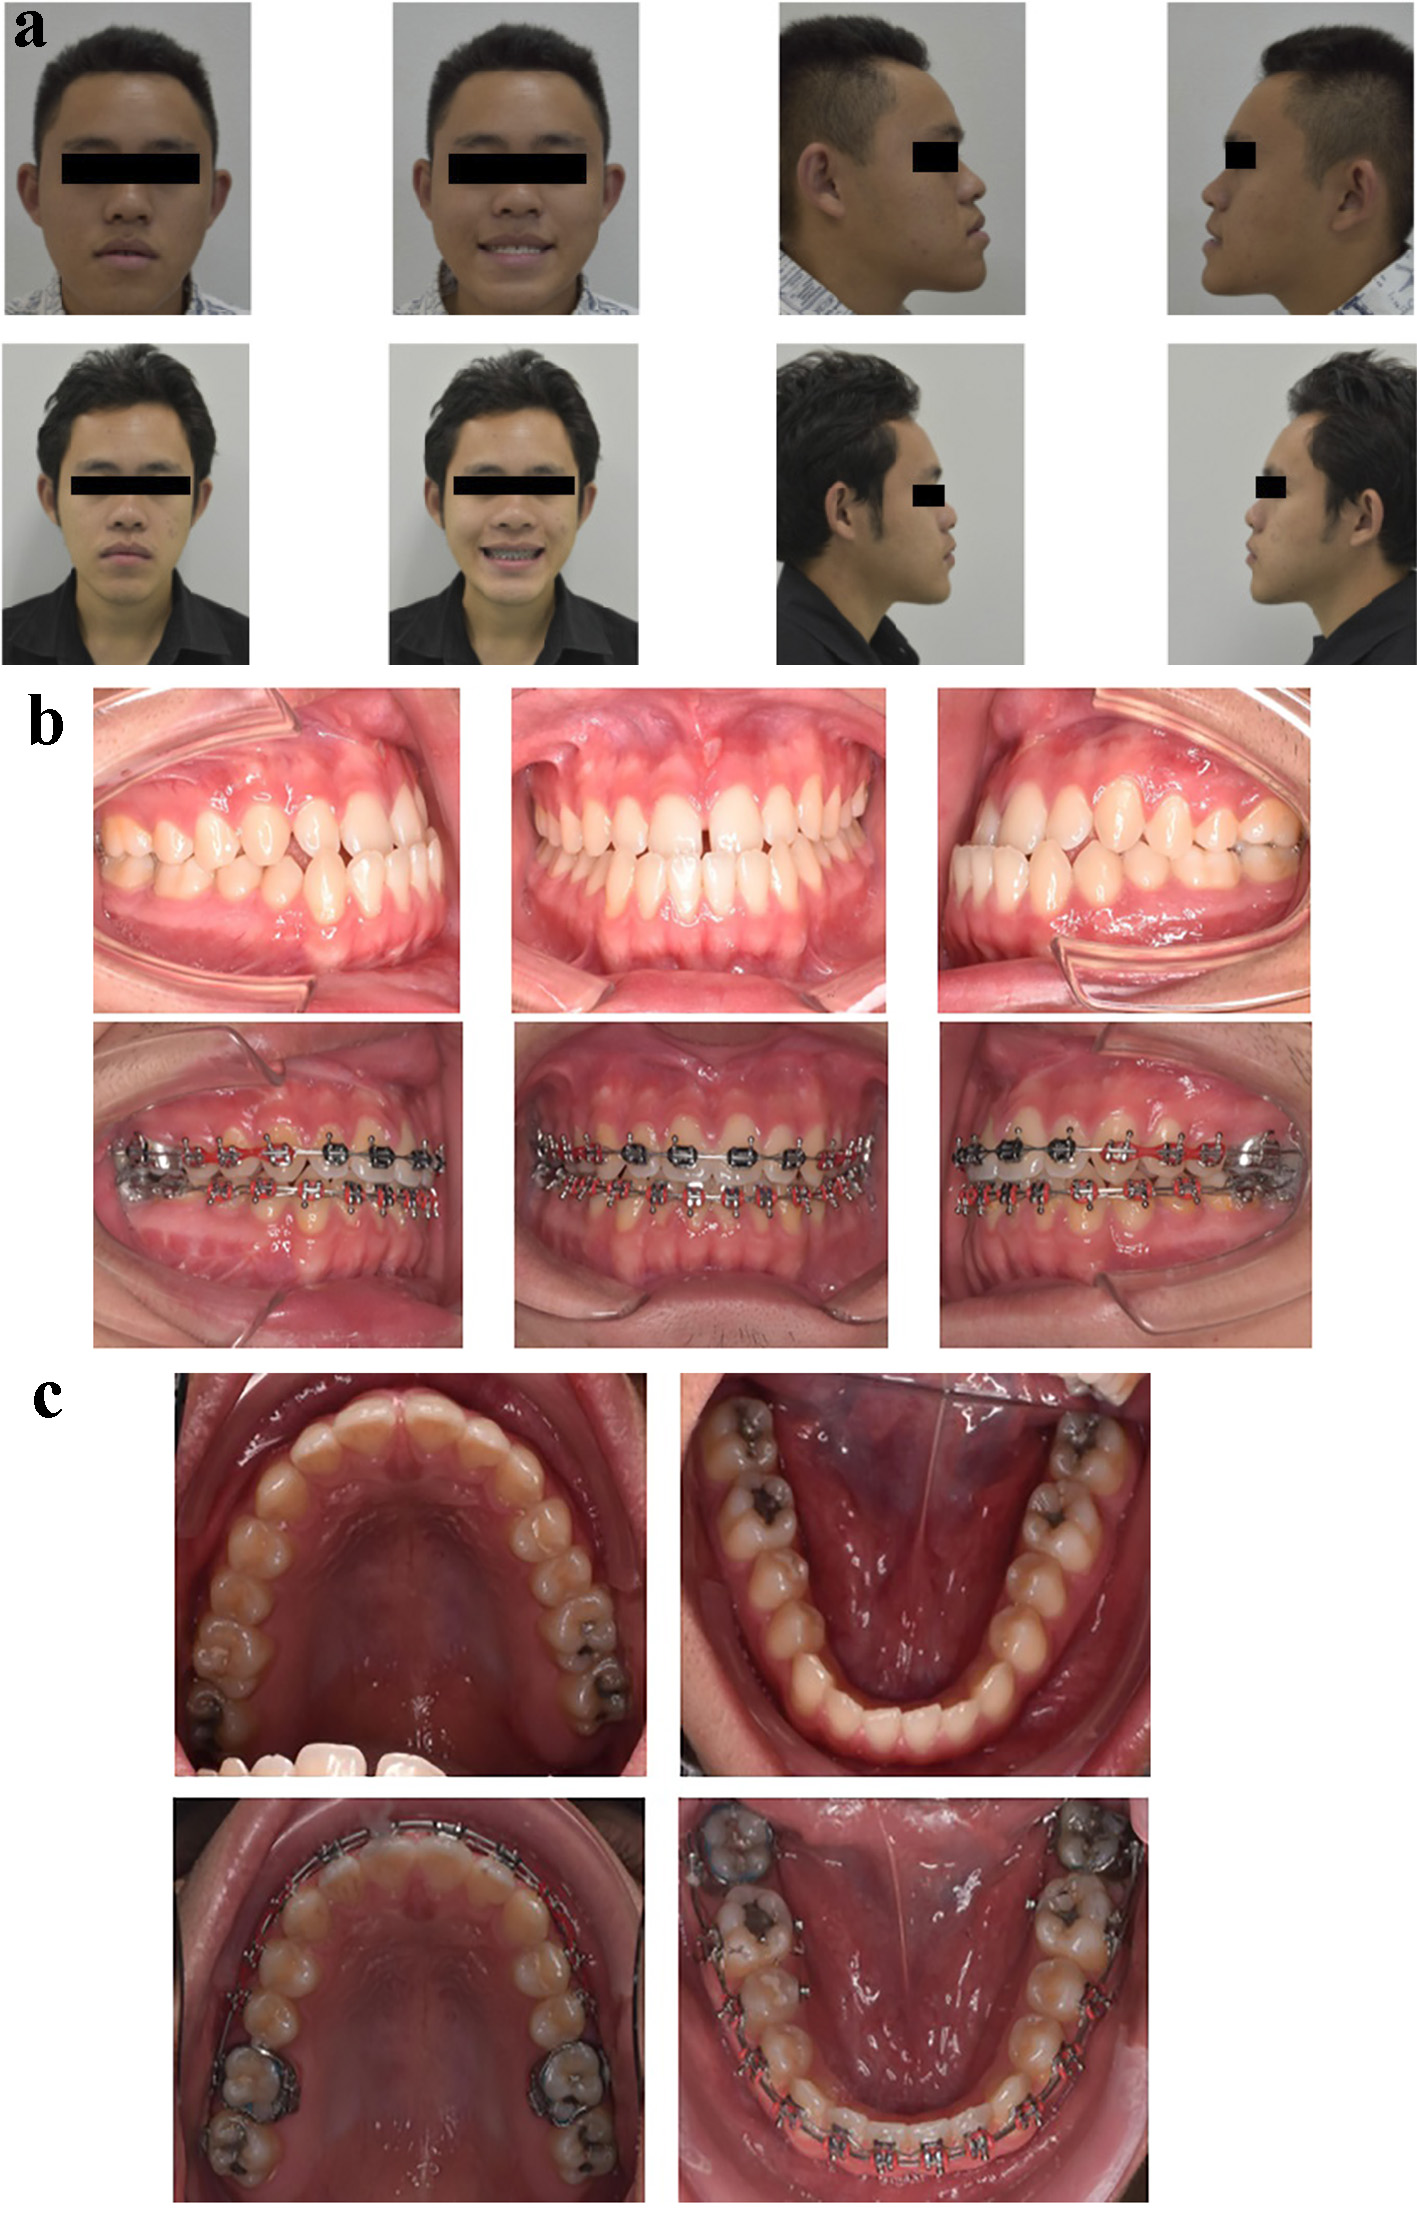
Figure 4. Progress of treatment in the representative patient. (a) Facial profile of the patient before and after surgery. (b, c) Final occlusion of the patient before and after surgery. Pretreatment records showed skeletal class III malocclusion with occlusal cannot and a concave profile due to maxillary retrognathism and mandibular prognathism. Postoperatively, good improvement in the facial profile, leveled maxillary occlusal plane, and good occlusal outcome were achieved.
Tables
Table 1. Measurements and Deviation of Actual Surgery From Surgical Simulation in All Three-Dimensional Landmarks
| Variables | T0 - T1 | P | RMSD |
|---|
| Mean | SD |
|---|
| SD: standard deviation. No significant difference was found. |
| Distance to FHP (mm) | | | | |
| U1 | 0.81 | 0.59 | 0.59 | 1.04 |
| L1 | 0.89 | 0.53 | 0.53 | 1.18 |
| 16 | -0.97 | 0.34 | 0.47 | 1.39 |
| 26 | -1.07 | 0.37 | 0.79 | 1.26 |
| Me | 1.25 | 0.43 | 0.14 | 1.45 |
| Distance to MSP (mm) | | | | |
| U1 | -0.23 | 0.33 | 0.58 | 0.86 |
| L1 | -0.58 | 0.46 | 0.21 | 0.91 |
| 16 | 0.71 | 0.54 | 0.7 | 1.12 |
| 26 | 0.58 | 0.38 | 0.63 | 1.25 |
| Me | 0.83 | 0.27 | 0.87 | 1.33 |
| Distance to CP (mm) | | | | |
| U1 | 0.93 | 0.43 | 0.75 | 1.23 |
| L1 | 0.98 | 0.78 | 0.23 | 1.46 |
| 16 | -1.05 | 0.76 | 0.55 | 1.24 |
| 26 | -1.09 | 0.93 | 0.74 | 1.39 |
| Me | 1.16 | 0.35 | 0.32 | 1.43 |
| Plane angulation relative to FHP (°) | | | | |
| OP | 1.06 | 0.69 | 0.28 | 1.29 |
| MnP | 1.41 | 0.65 | 0.08 | 1.45 |
| Plane angulation relative to MSP (°) | | | | |
| OP | 0.98 | 0.47 | 0.59 | 1.27 |
| MnP | 1.18 | 0.51 | 0.23 | 1.37 |
Table 2. Accuracy (Bland-Altman Upper and Lower Limits) of Linear Differences to MSP Between the Planned and Postoperative Outcomes
| Linear difference (mm), 95% CI |
|---|
| Lower limit | Upper limit |
|---|
| U1 | -0.89 (-1.21 to -0.56) | 0.42 (0.1 to 0.74) |
| L1 | -1.49 (-1.93 to -1.04) | 0.33 (-0.12 to 0.78) |
Table 3. Initial Measurements Versus Repeated Surgical Simulations Measurements
| First and second measurements | r | Paired differences relative to FHP |
|---|
| Mean | SD | P |
|---|
| U1 | 0.97 | 0.04 | 0.59 | 0.778 |
| L1 | 0.98 | 0.19 | 0.69 | 0.3 |
| 16 | 0.96 | -0.05 | 0.49 | 0.69 |
| 26 | 0.99 | 0.05 | 0.36 | 0.61 |
| Me | 0.99 | 0.06 | 0.43 | 0.59 |
| OP | 0.98 | -0.38 | 0.75 | 0.07 |
| MnP | 0.97 | -0.32 | 0.66 | 0.08 |