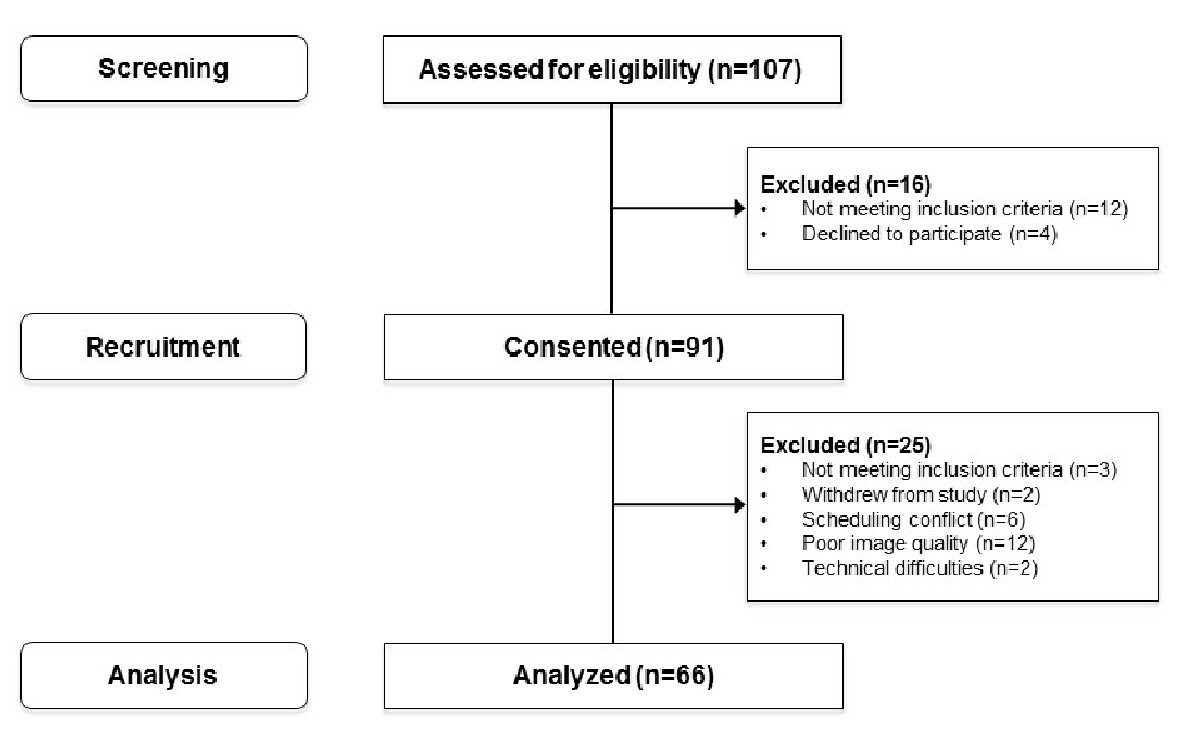
Figure 1. Flow diagram of patient screening, recruitment and analysis from September 2014 to July 2016.
| Journal of Clinical Medicine Research, ISSN 1918-3003 print, 1918-3011 online, Open Access |
| Article copyright, the authors; Journal compilation copyright, J Clin Med Res and Elmer Press Inc |
| Journal website http://www.jocmr.org |
Original Article
Volume 10, Number 5, May 2018, pages 391-395
Sidestream Dark Field Imaging of the Microcirculation to Assess Preeclampsia Microvascular Dysfunction
Figures
Tables
| Characteristic | No preeclampsia (n = 54) | Preeclampsia (n = 10) | Severe preeclampsia (n = 2) |
|---|---|---|---|
| *Several patients were enrolled who met more than one inclusion criterion. Data are presented as n (%) or mean ± standard deviation (SD). | |||
| Age (years) | 31.7 ± 3.9 | 31.0 ± 4.1 | 32.5 ± 5.0 |
| BMI (kg/m2) | 31.4 ± 9.8 | 32.4 ± 8.2 | 35.1 ± 1.0 |
| Gestational age (weeks) | 19.2 ± 1.7 | 19.8 ± 1.7 | 19.3 ± 0.6 |
| Inclusion criteria (n (%))* | |||
| Previous preeclampsia | 11 (20.4) | 4 (40) | 0 |
| Pre-existing renal disease | 2 (3.7) | 1 (10) | 0 |
| Pre-existing diabetes mellitus | 18 (33.3) | 1 (10) | 1 (50) |
| Antiphospholipid syndrome | 1 (1.9) | 1 (10) | 0 |
| BMI ≥ 35 | 29 (53.7) | 3 (30) | 1 (50) |
| Pre-existing hypertension | 5 (9.3) | 2 (20) | 0 |
| Multiple pregnancy | 4 (7.4) | 4 (40) | 1 (50) |
| Age > 40 years | 3 (5.6) | 0 | 0 |
| Family history of preeclampsia | 1 (1.9) | 0 | 0 |
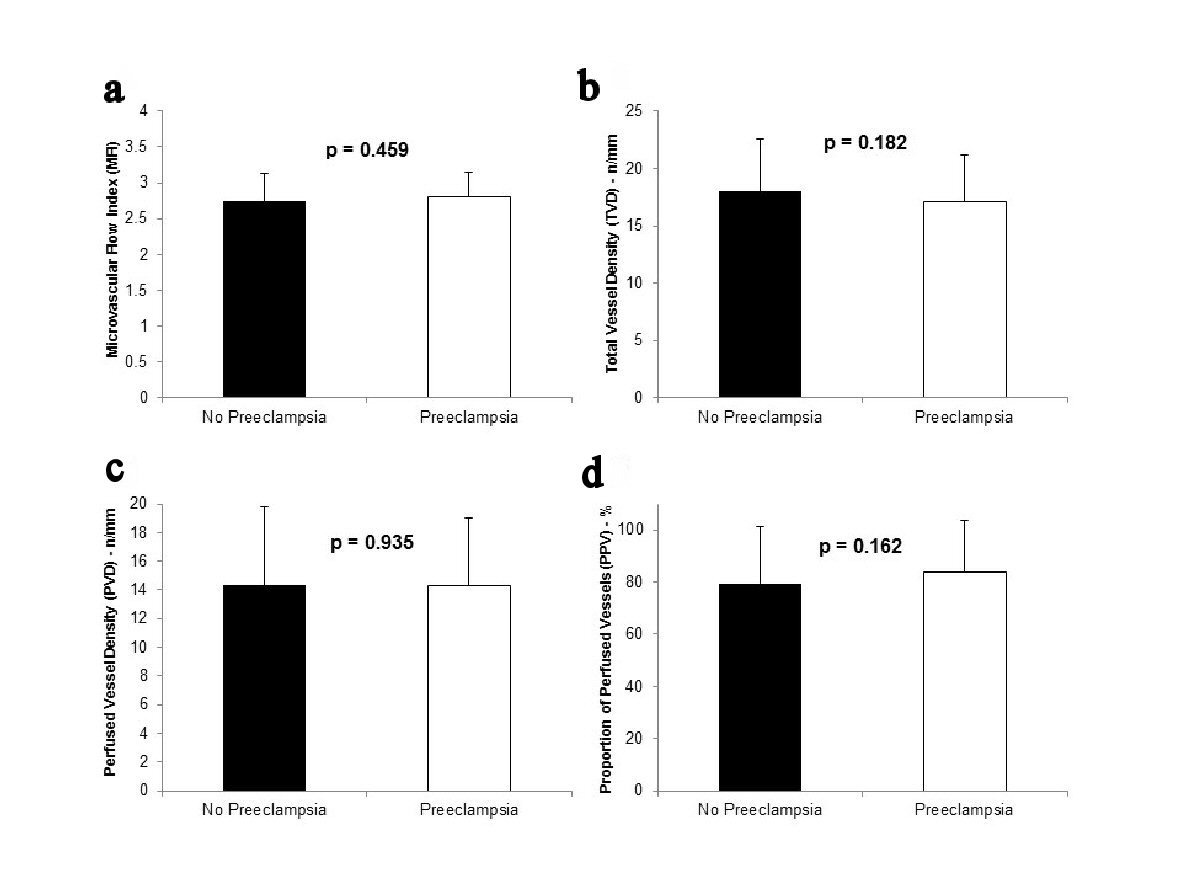
| Microcirculatory Parameter | No preeclampsia (n = 54) | Preeclampsia (n = 10) | Severe preeclampsia (n = 2) |
|---|---|---|---|
| Data are presented as means ± SD. | |||
| MFI | 2.75 ± 0.38 | 2.79 ± 0.34 | 2.79 ± 0.34 |
| TVD (n/mm) | 17.99 ± 4.62 | 17.12 ± 4.12 | 17.14 ± 3.62 |
| PVD (n/mm) | 14.32 ± 5.47 | 14.06 ± 4.82 | 15.23 ± 4.43 |
| PPV (%) | 79.38 ± 21.38 | 82.86 ± 21.10 | 87.76 ± 13.07 |