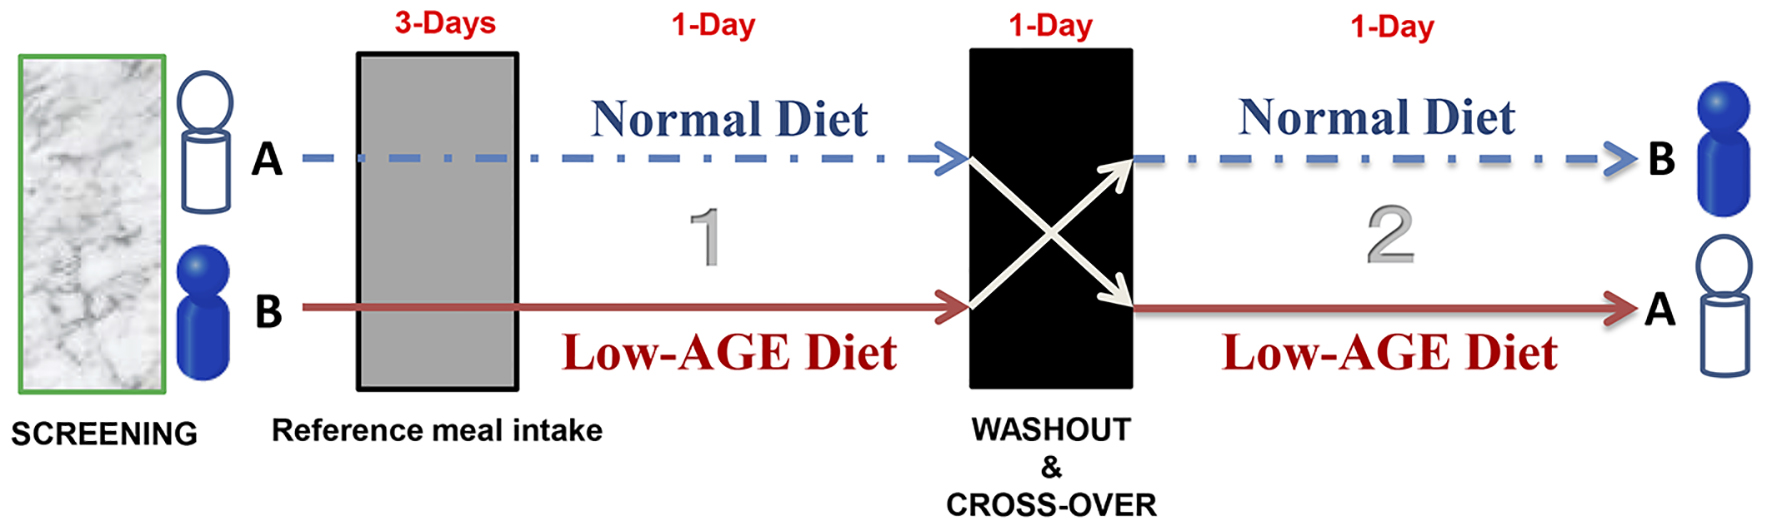
Figure 1. Schematic illustration of the protocol.
| Journal of Clinical Medicine Research, ISSN 1918-3003 print, 1918-3011 online, Open Access |
| Article copyright, the authors; Journal compilation copyright, J Clin Med Res and Elmer Press Inc |
| Journal website http://www.jocmr.org |
Original Article
Volume 10, Number 5, May 2018, pages 405-410
Effects of a Low Advanced Glycation End Products Diet on Insulin Levels: The Feasibility of a Crossover Comparison Test
Figures
Tables
| Menu | Cooking method | Energy | Protein | Fat | Carbohydrate |
|---|---|---|---|---|---|
| Normal diet | |||||
| Bread | Baked | 158 | 5.6 | 2.6 | 28 |
| Fried vegetables | Fried | 177 | 6.3 | 7.8 | 23 |
| Fried egg | Fried | 76 | 6.2 | 5.2 | 0.2 |
| Olive oil | 55 | 0 | 6 | 0 | |
| Hashed browns | Oven | 91 | 1.4 | 4.5 | 11.8 |
| Banana Chip | Fried | 103 | 0.3 | 5.5 | 12.7 |
| Total | 660 | 19.8 | 31.6 | 75.7 | |
| E% | 12.0 | 43.1 | 45.9 | ||
| Low-AGE diet | |||||
| Bread | 106 | 3.7 | 1.7 | 18.7 | |
| Olive oil | Raw | 92 | 0 | 10 | 0 |
| Salad | Raw | 113 | 6.3 | 0.8 | 23 |
| Olive oil | 92 | 0 | 10 | 0 | |
| Boiled egg | Boiled | 76 | 6.2 | 5.2 | 0.2 |
| Steamed potatoes | Steam | 76 | 1.4 | 0.1 | 17.7 |
| Banana | Raw | 77 | 0.9 | 0.1 | 20.2 |
| Total | 632 | 18.5 | 27.9 | 79.8 | |
| E% | 11.7 | 39.7 | 50.5 |
| Variables | Baseline, mean (SD) |
|---|---|
| BMI: body mass index; IRI: plasma immunoreactive insulin. | |
| Number (male/female) | 5 (2/3) |
| Age (years) | 41.4 (7.6) |
| Weight (kg) | 59.0 (9.2) |
| BMI (kg/m2) | 21.7 (2.6) |
| Plasma glucose (mmol/L) | 5.3 (0.1) |
| IRI (pmol/L) | 46.0 (15.7) |
| HbA1c (%) | 5.6 (0.3) |
| Total cholesterol (mmol/L) | 5.5 (0.7) |
| Triglycerides (mmol/L) | 0.8 (0.3) |
| HDL-cholesterol (mmol/L) | 1.7 (0.4) |
| LDL-cholesterol (mmol/L) | 3.3 (0.4) |
| Total protein (g/dL) | 8.1 (0.3) |
| Albumin (g/dL) | 5.1 (0.2) |
| AST (U/L) | 26.8 (8.2) |
| ALT (U/L) | 31.2 (19.7) |
| γ-GTP (U/L) | 26.0 (12.8) |
| 25(OH) D (nmol/L) | 40.7 (18.0) |