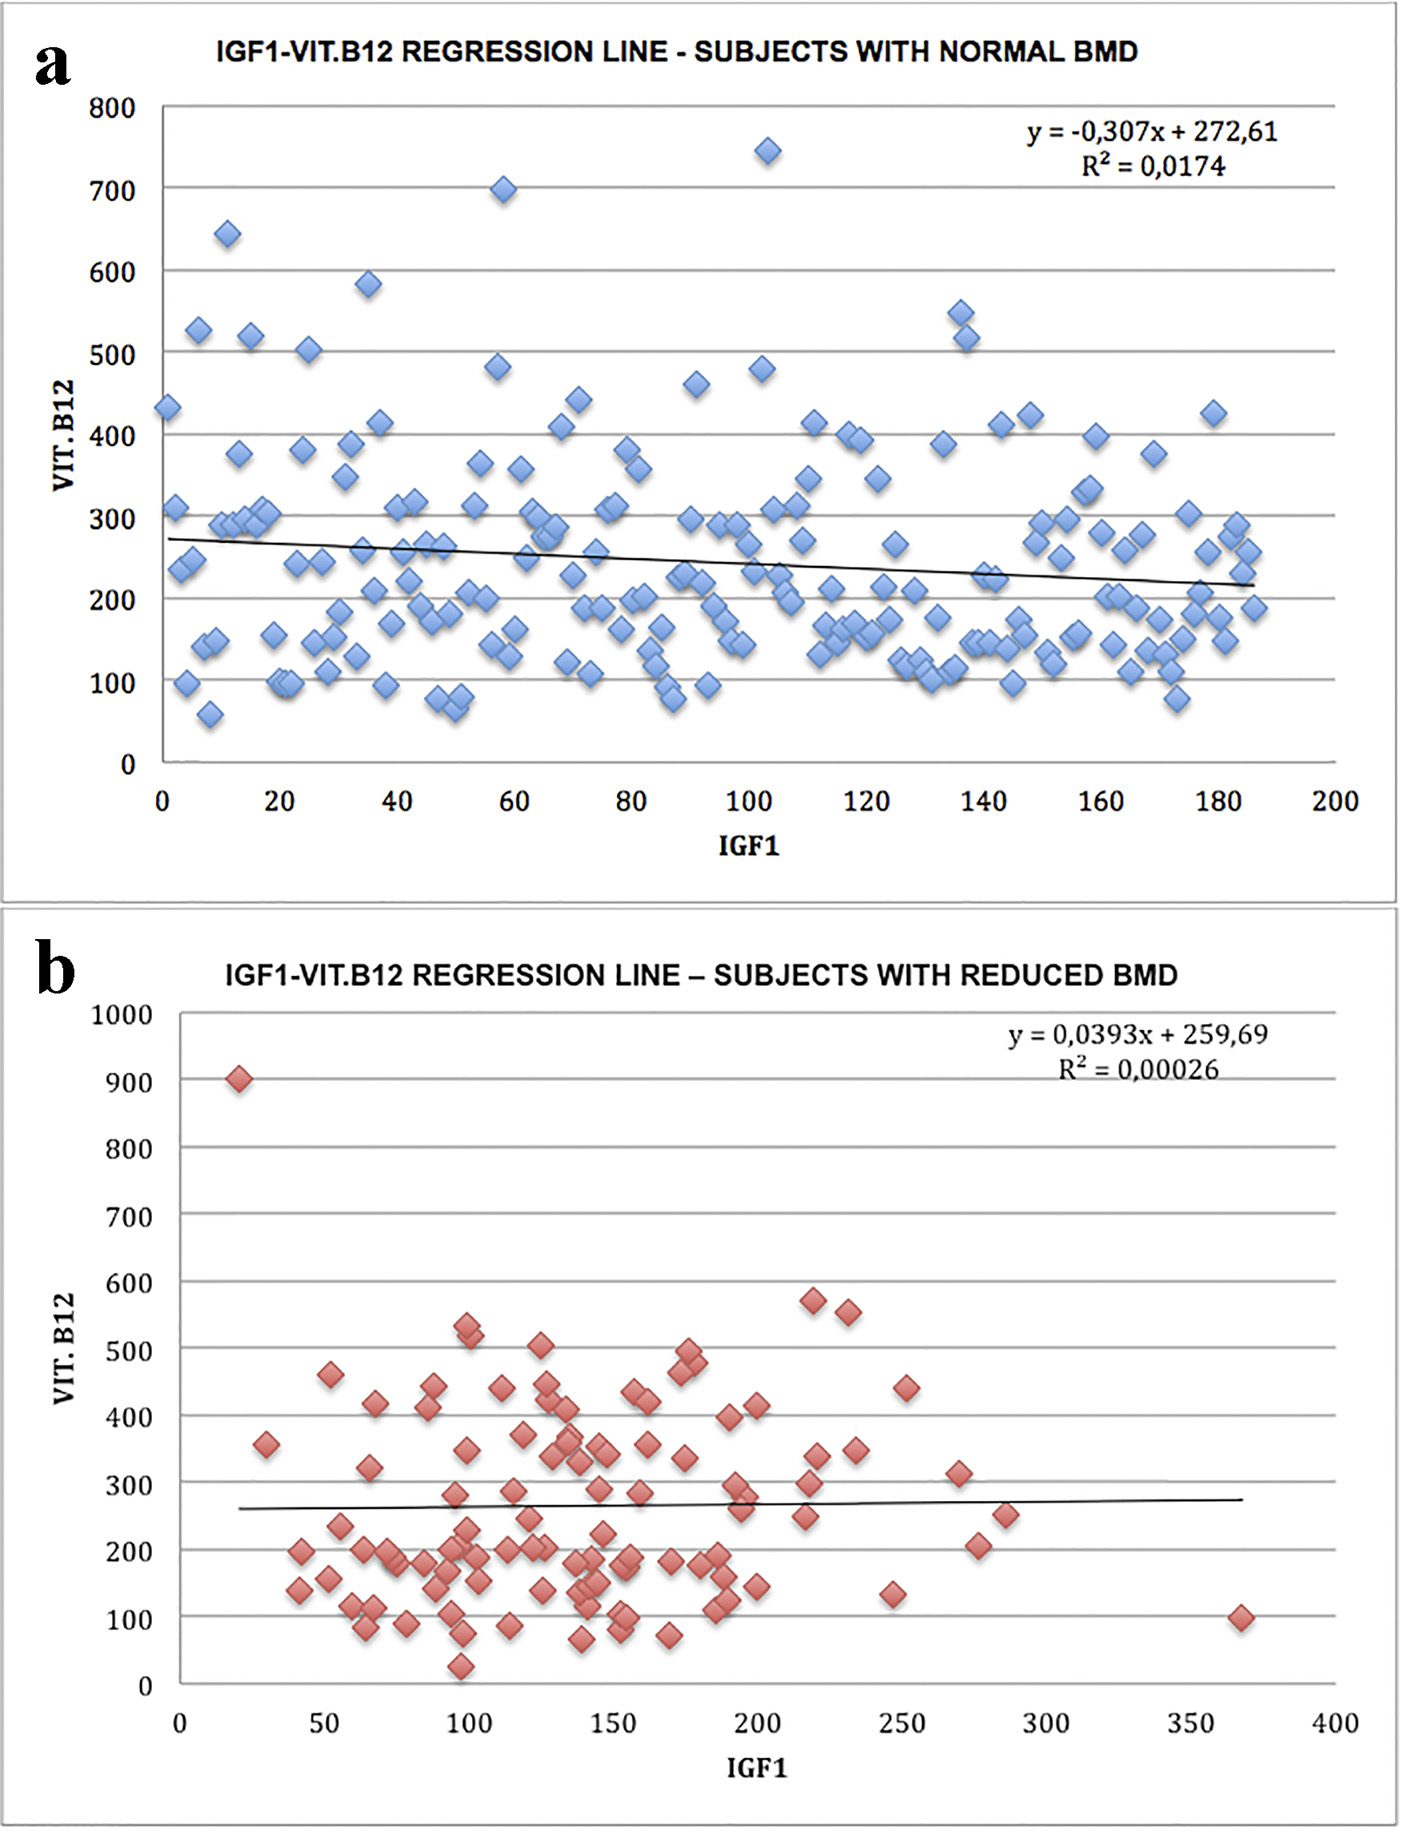
Figure 1. Linear IGF-1-vitamin B12 correlation: regression lines: (a) subjects with normal bone density; (b) subjects with bone mass reduction.
| Journal of Clinical Medicine Research, ISSN 1918-3003 print, 1918-3011 online, Open Access |
| Article copyright, the authors; Journal compilation copyright, J Clin Med Res and Elmer Press Inc |
| Journal website http://www.jocmr.org |
Original Article
Volume 10, Number 3, March 2018, pages 233-239
Assessment of Serum Vitamin B12 Levels and Other Metabolic Parameters in Subjects With Different Values of Bone Mineral Density
Figures
Table
| Subject with normal BMD | Subject with reduced BMD | P value | |
|---|---|---|---|
| Sample dimension (n) | 186 (64.8%) | 101 (35.2%) osteopenic (n = 75) osteoporotic (n = 26) | |
| Average age (years) Total population | 51 ± 12.54 | 56 ± 12.95 | P = 0.0003 (t-test) |
| Women | n = 124 (66.6%) Average age: 51 years 95% CI: 49.33 - 53.36 | n = 66 (65.3%) Average age: 59 years 95% CI: 56.34 - 61.84 | P < 0.0001 (t-test) |
| Men | n = 62 (33.3%) Average age: 49 years 95% CI: 45.47 - 52.76 | n = 35 (34.6%) Average age: 51 years 95% CI: 46.44 - 56.13 | P = 0.4724 (t-test) |
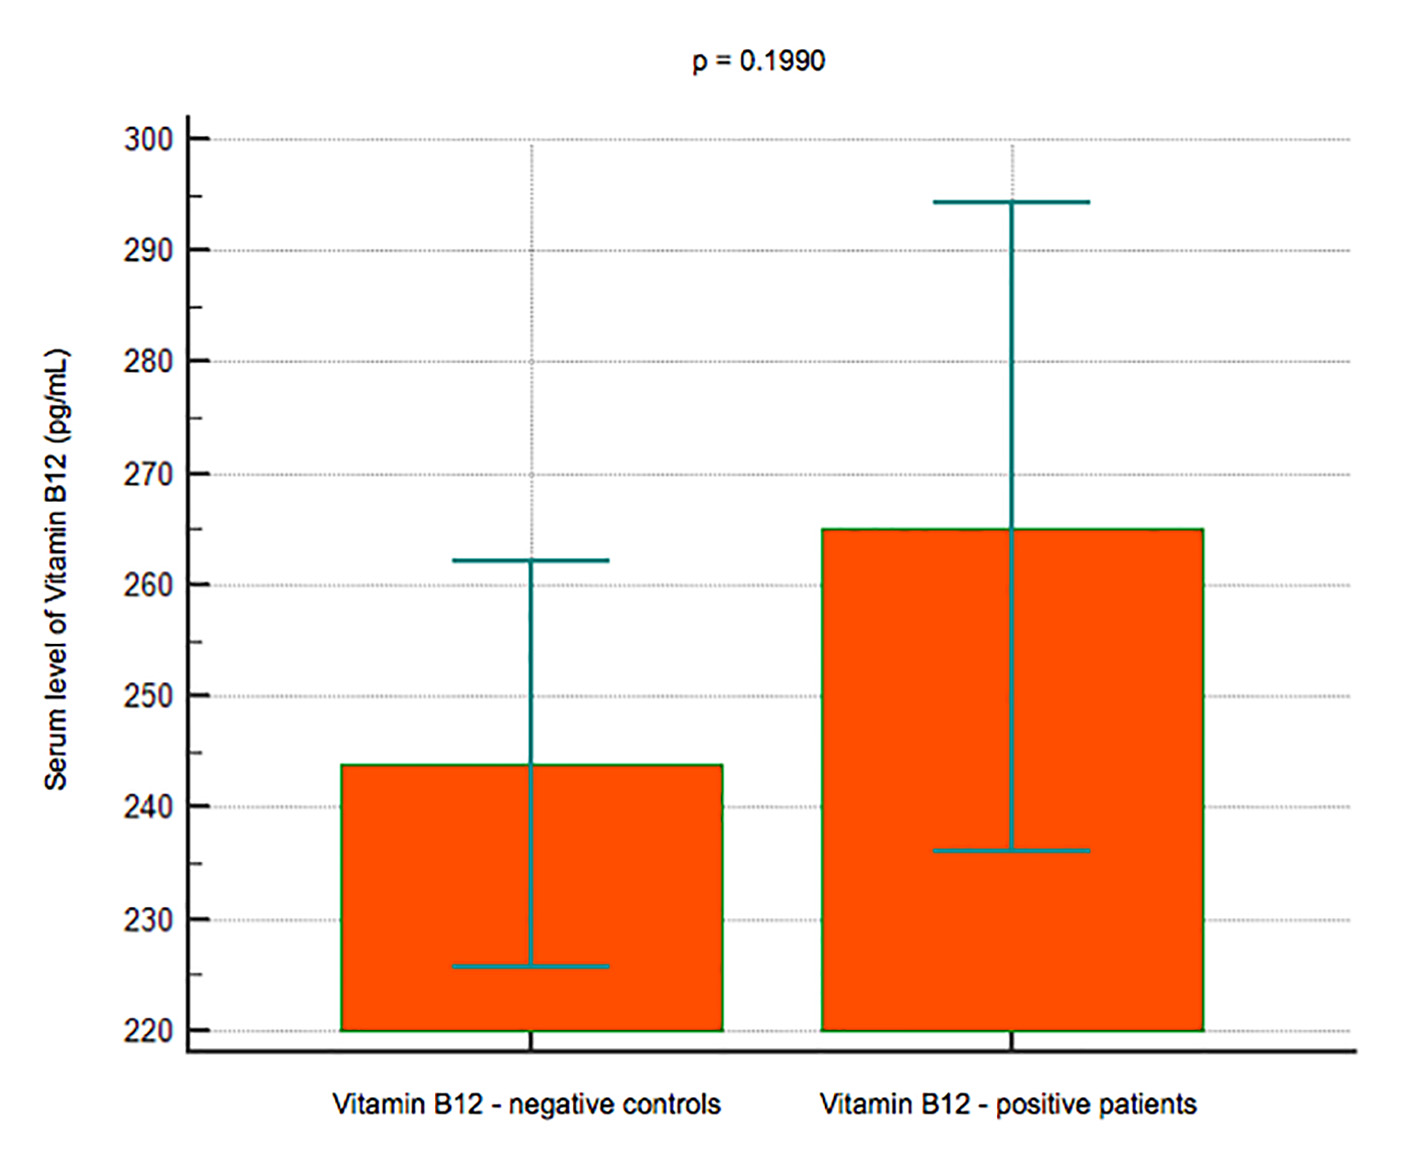
| Vitamine B12 (pg/mL) | Mean: 243.91 95% CI: 225.78 - 262.03 SE: 9.19 | Mean: 265.15 95% CI: 236.04 - 294.25 SE: 14.67 | P = 0.1990 (t-test) |
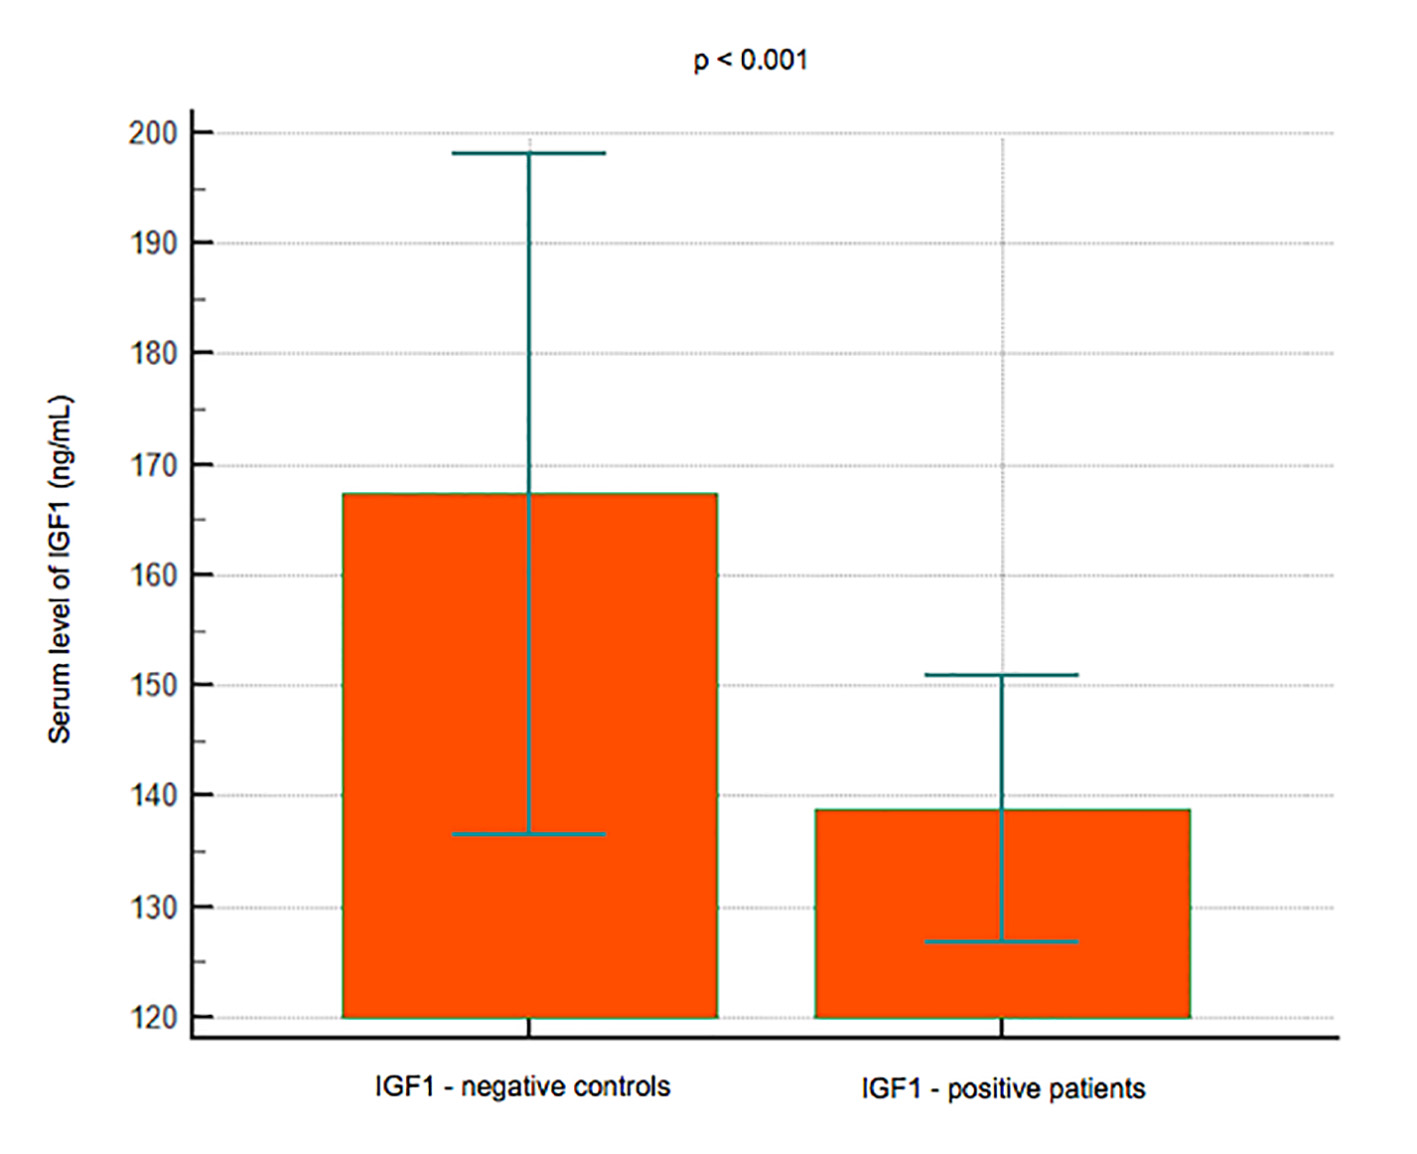
| IGF-1 (ng/mL) | Mean: 167.34 95% CI: 136.49 - 198.18 SE: 15.64 | Mean: 138.79 95% CI: 126.75 - 150.83 SE: 6.07 | P < 0.001 (F-test) |